# GreptimeDB Getting Started Quick Start
> A 10-minute guide to GreptimeDB's core capabilities — from ingestion to cross-signal correlation across metrics, logs, and traces.
# Quick Start
Before proceeding, please ensure you have [installed GreptimeDB](./installation/overview.md).
This guide uses SQL to walk you through GreptimeDB's core capabilities — from ingestion to cross-signal correlation across metrics, logs, and traces. SQL is also GreptimeDB's management interface for creating tables, setting TTL policies, and configuring indexes.
:::tip Already running Prometheus, OpenTelemetry, Loki or ES?
You can start ingesting data immediately using your existing tools — no schema creation needed (GreptimeDB [creates tables automatically](/user-guide/ingest-data/overview.md#automatic-schema-generation)):
- [Prometheus Remote Write](/user-guide/ingest-data/for-observability/prometheus.md)
- [OpenTelemetry (OTLP)](/user-guide/ingest-data/for-observability/opentelemetry.md)
- [Loki Protocol](/user-guide/ingest-data/for-observability/loki.md)
- [Elasticsearch](/user-guide/ingest-data/for-observability/elasticsearch/)
Continue with this guide to see what you can do with the data once it's in.
:::
**You'll learn (10–15 minutes):**
- Connect to GreptimeDB and create metrics, logs, and traces tables
- Query and aggregate data with SQL
- Search logs by keyword with full-text index
- Compute p95 latency in time windows using range queries
- **Correlate metrics, logs, and traces in a single query**
- Combine SQL and PromQL
## Connect to GreptimeDB
GreptimeDB supports [multiple protocols](/user-guide/protocols/overview.md) for interacting with the database. In this guide, we use SQL for simplicity.
If your GreptimeDB instance is running on `127.0.0.1` with the MySQL client default port `4002` or the PostgreSQL client default port `4003`, connect using:
```shell
mysql -h 127.0.0.1 -P 4002
```
Or
```shell
psql -h 127.0.0.1 -p 4003 -d public
```
You can also use the built-in Dashboard at `http://127.0.0.1:4000/dashboard` to run all the SQL queries in this guide.
By default, GreptimeDB does not have [authentication](/user-guide/deployments-administration/authentication/overview.md) enabled. You can connect without providing a username and password.
## Create tables
We'll create three tables to simulate a real scenario: gRPC latency metrics, application logs, and request traces. Two application servers, `host1` and `host2`, are recording data. Starting from `2024-07-11 20:00:10`, `host1` begins experiencing issues.
### Metrics table
```sql
-- Metrics: gRPC call latency in milliseconds
CREATE TABLE grpc_latencies (
ts TIMESTAMP TIME INDEX,
host STRING,
method_name STRING,
latency DOUBLE,
PRIMARY KEY (host, method_name)
);
```
- `ts`: Timestamp when the metric was collected (the [time index](/user-guide/concepts/data-model.md)).
- `host` and `method_name`: [Tag](/user-guide/concepts/data-model.md) columns identifying the time series.
- `latency`: [Field](/user-guide/concepts/data-model.md) column containing the actual measurement.
### Logs table
```sql
-- Logs: application error logs
CREATE TABLE app_logs (
ts TIMESTAMP TIME INDEX,
host STRING,
api_path STRING,
log_level STRING,
log_msg STRING FULLTEXT INDEX WITH('case_sensitive' = 'false'),
PRIMARY KEY (host, log_level)
) WITH ('append_mode'='true');
```
- `log_msg` enables [full-text index](/user-guide/manage-data/data-index.md#fulltext-index) for keyword search.
- [`append_mode`](/user-guide/deployments-administration/performance-tuning/design-table.md#when-to-use-append-only-tables) optimizes for log workloads (no deduplication overhead).
### Traces table
```sql
-- Traces: request spans
CREATE TABLE traces (
ts TIMESTAMP TIME INDEX,
trace_id STRING SKIPPING INDEX,
span_id STRING,
parent_span_id STRING,
service_name STRING,
operation STRING,
duration DOUBLE,
status_code INT,
PRIMARY KEY (service_name)
) WITH ('append_mode'='true');
```
For high-cardinality `trace_id`s, we have enabled the [skip index](/user-guide/manage-data/data-index.md#skipping-index).
:::tip
We use SQL to ingest data below, so we create the tables manually. However, GreptimeDB is [schemaless](/user-guide/ingest-data/overview.md#automatic-schema-generation) — when using protocols like OpenTelemetry, Prometheus Remote Write, or InfluxDB Line Protocol, tables are created automatically.
:::
## Write data
Let's insert sample data simulating the scenario. Before `20:00:10`, both hosts are normal. After `20:00:10`, `host1` starts experiencing latency spikes.
### Normal period (before 20:00:10)
```sql
INSERT INTO grpc_latencies (ts, host, method_name, latency) VALUES
('2024-07-11 20:00:06', 'host1', 'GetUser', 103.0),
('2024-07-11 20:00:06', 'host2', 'GetUser', 113.0),
('2024-07-11 20:00:07', 'host1', 'GetUser', 103.5),
('2024-07-11 20:00:07', 'host2', 'GetUser', 107.0),
('2024-07-11 20:00:08', 'host1', 'GetUser', 104.0),
('2024-07-11 20:00:08', 'host2', 'GetUser', 96.0),
('2024-07-11 20:00:09', 'host1', 'GetUser', 104.5),
('2024-07-11 20:00:09', 'host2', 'GetUser', 114.0);
```
### Anomalous period (after 20:00:10)
`host1`'s latency becomes unstable with spikes up to several thousand milliseconds:
Click to expand INSERT statements
```sql
INSERT INTO grpc_latencies (ts, host, method_name, latency) VALUES
('2024-07-11 20:00:10', 'host1', 'GetUser', 150.0),
('2024-07-11 20:00:10', 'host2', 'GetUser', 110.0),
('2024-07-11 20:00:11', 'host1', 'GetUser', 200.0),
('2024-07-11 20:00:11', 'host2', 'GetUser', 102.0),
('2024-07-11 20:00:12', 'host1', 'GetUser', 1000.0),
('2024-07-11 20:00:12', 'host2', 'GetUser', 108.0),
('2024-07-11 20:00:13', 'host1', 'GetUser', 80.0),
('2024-07-11 20:00:13', 'host2', 'GetUser', 111.0),
('2024-07-11 20:00:14', 'host1', 'GetUser', 4200.0),
('2024-07-11 20:00:14', 'host2', 'GetUser', 95.0),
('2024-07-11 20:00:15', 'host1', 'GetUser', 90.0),
('2024-07-11 20:00:15', 'host2', 'GetUser', 115.0),
('2024-07-11 20:00:16', 'host1', 'GetUser', 3000.0),
('2024-07-11 20:00:16', 'host2', 'GetUser', 95.0),
('2024-07-11 20:00:17', 'host1', 'GetUser', 320.0),
('2024-07-11 20:00:17', 'host2', 'GetUser', 115.0),
('2024-07-11 20:00:18', 'host1', 'GetUser', 3500.0),
('2024-07-11 20:00:18', 'host2', 'GetUser', 95.0),
('2024-07-11 20:00:19', 'host1', 'GetUser', 100.0),
('2024-07-11 20:00:19', 'host2', 'GetUser', 115.0),
('2024-07-11 20:00:20', 'host1', 'GetUser', 2500.0),
('2024-07-11 20:00:20', 'host2', 'GetUser', 95.0);
```
### Error logs during the anomaly
```sql
INSERT INTO app_logs (ts, host, api_path, log_level, log_msg) VALUES
('2024-07-11 20:00:10', 'host1', '/api/v1/resource', 'ERROR', 'Connection timeout'),
('2024-07-11 20:00:10', 'host1', '/api/v1/billings', 'ERROR', 'Connection timeout'),
('2024-07-11 20:00:11', 'host1', '/api/v1/resource', 'ERROR', 'Database unavailable'),
('2024-07-11 20:00:11', 'host1', '/api/v1/billings', 'ERROR', 'Database unavailable'),
('2024-07-11 20:00:12', 'host1', '/api/v1/resource', 'ERROR', 'Service overload'),
('2024-07-11 20:00:12', 'host1', '/api/v1/billings', 'ERROR', 'Service overload'),
('2024-07-11 20:00:13', 'host1', '/api/v1/resource', 'ERROR', 'Connection reset'),
('2024-07-11 20:00:13', 'host1', '/api/v1/billings', 'ERROR', 'Connection reset'),
('2024-07-11 20:00:14', 'host1', '/api/v1/resource', 'ERROR', 'Timeout'),
('2024-07-11 20:00:14', 'host1', '/api/v1/billings', 'ERROR', 'Timeout'),
('2024-07-11 20:00:15', 'host1', '/api/v1/resource', 'ERROR', 'Disk full'),
('2024-07-11 20:00:15', 'host1', '/api/v1/billings', 'ERROR', 'Disk full'),
('2024-07-11 20:00:16', 'host1', '/api/v1/resource', 'ERROR', 'Network issue'),
('2024-07-11 20:00:16', 'host1', '/api/v1/billings', 'ERROR', 'Network issue');
```
### Trace spans during the anomaly
```sql
INSERT INTO traces (ts, trace_id, span_id, parent_span_id, service_name, operation, duration, status_code) VALUES
('2024-07-11 20:00:12', 'abc123', 'span1', '', 'host1', 'POST /api/v1/resource', 1050.0, 2),
('2024-07-11 20:00:12', 'abc123', 'span2', 'span1', 'host1', 'GetUser', 1000.0, 2),
('2024-07-11 20:00:14', 'def456', 'span3', '', 'host1', 'POST /api/v1/billings', 4250.0, 2),
('2024-07-11 20:00:14', 'def456', 'span4', 'span3', 'host1', 'CreateBilling', 4200.0, 2),
('2024-07-11 20:00:16', 'ghi789', 'span5', '', 'host1', 'POST /api/v1/resource', 3100.0, 2),
('2024-07-11 20:00:16', 'ghi789', 'span6', 'span5', 'host1', 'GetUser', 3000.0, 2),
('2024-07-11 20:00:12', 'jkl012', 'span7', '', 'host2', 'POST /api/v1/resource', 115.0, 0),
('2024-07-11 20:00:12', 'jkl012', 'span8', 'span7', 'host2', 'GetUser', 108.0, 0);
```
## Query data
### Filter by tags and time index
Query the latency of `host1` after `2024-07-11 20:00:15`:
```sql
SELECT *
FROM grpc_latencies
WHERE host = 'host1' AND ts > '2024-07-11 20:00:15';
```
```sql
+---------------------+-------+-------------+---------+
| ts | host | method_name | latency |
+---------------------+-------+-------------+---------+
| 2024-07-11 20:00:16 | host1 | GetUser | 3000 |
| 2024-07-11 20:00:17 | host1 | GetUser | 320 |
| 2024-07-11 20:00:18 | host1 | GetUser | 3500 |
| 2024-07-11 20:00:19 | host1 | GetUser | 100 |
| 2024-07-11 20:00:20 | host1 | GetUser | 2500 |
+---------------------+-------+-------------+---------+
5 rows in set (0.14 sec)
```
Calculate the 95th percentile latency grouped by host:
```sql
SELECT
host,
approx_percentile_cont(0.95) WITHIN GROUP (ORDER BY latency) AS p95_latency
FROM grpc_latencies
WHERE ts >= '2024-07-11 20:00:10'
GROUP BY host;
```
```sql
+-------+-------------------+
| host | p95_latency |
+-------+-------------------+
| host1 | 4164.999999999999 |
| host2 | 115 |
+-------+-------------------+
2 rows in set (0.11 sec)
```
### Search logs by keyword
The `@@` operator performs [full-text search](/user-guide/logs/fulltext-search.md) on indexed columns:
```sql
SELECT *
FROM app_logs
WHERE lower(log_msg) @@ 'timeout'
AND ts > '2024-07-11 20:00:00'
ORDER BY ts;
```
```sql
+---------------------+-------+------------------+-----------+--------------------+
| ts | host | api_path | log_level | log_msg |
+---------------------+-------+------------------+-----------+--------------------+
| 2024-07-11 20:00:10 | host1 | /api/v1/billings | ERROR | Connection timeout |
| 2024-07-11 20:00:10 | host1 | /api/v1/resource | ERROR | Connection timeout |
| 2024-07-11 20:00:14 | host1 | /api/v1/billings | ERROR | Timeout |
| 2024-07-11 20:00:14 | host1 | /api/v1/resource | ERROR | Timeout |
+---------------------+-------+------------------+-----------+--------------------+
```
### Range query
Use [range queries](/reference/sql/range.md) to calculate the p95 latency in 5-second windows:
```sql
SELECT
ts,
host,
approx_percentile_cont(0.95) WITHIN GROUP (ORDER BY latency)
RANGE '5s' AS p95_latency
FROM grpc_latencies
ALIGN '5s' FILL PREV
ORDER BY host, ts;
```
```sql
+---------------------+-------+-------------+
| ts | host | p95_latency |
+---------------------+-------+-------------+
| 2024-07-11 20:00:05 | host1 | 104.5 |
| 2024-07-11 20:00:10 | host1 | 4200 |
| 2024-07-11 20:00:15 | host1 | 3500 |
| 2024-07-11 20:00:20 | host1 | 2500 |
| 2024-07-11 20:00:05 | host2 | 114 |
| 2024-07-11 20:00:10 | host2 | 111 |
| 2024-07-11 20:00:15 | host2 | 115 |
| 2024-07-11 20:00:20 | host2 | 95 |
+---------------------+-------+-------------+
8 rows in set (0.06 sec)
```
Range queries are powerful for time-window aggregation. Read the [manual](/reference/sql/range.md) to learn more.
### Correlate metrics, logs, and traces
This is where a unified database shines. One query to correlate p95 latency, error counts, and slow trace spans — across all three signal types:
```sql
WITH
-- Metrics: per-host p95 latency in 5s windows
metrics AS (
SELECT
ts, host,
approx_percentile_cont(0.95) WITHIN GROUP (ORDER BY latency)
RANGE '5s' AS p95_latency
FROM grpc_latencies
ALIGN '5s' FILL PREV
),
-- Logs: per-host ERROR count in 5s windows
logs AS (
SELECT
ts, host,
count(log_msg) RANGE '5s' AS num_errors
FROM app_logs
WHERE log_level = 'ERROR'
ALIGN '5s'
),
-- Traces: per-host slow span count in 5s windows
slow_traces AS (
SELECT
date_bin(INTERVAL '5' seconds, ts) AS ts,
service_name AS host,
COUNT(*) AS slow_spans,
MAX(duration) AS max_span_duration
FROM traces
WHERE duration > 500
GROUP BY date_bin(INTERVAL '5' seconds, ts), service_name
)
SELECT
m.ts,
m.host,
m.p95_latency,
COALESCE(l.num_errors, 0) AS num_errors,
COALESCE(t.slow_spans, 0) AS slow_spans,
t.max_span_duration
FROM metrics m
LEFT JOIN logs l ON m.host = l.host AND m.ts = l.ts
LEFT JOIN slow_traces t ON m.host = t.host AND m.ts = t.ts
ORDER BY m.ts, m.host;
```
```sql
+---------------------+-------+-------------+------------+------------+-------------------+
| ts | host | p95_latency | num_errors | slow_spans | max_span_duration |
+---------------------+-------+-------------+------------+------------+-------------------+
| 2024-07-11 20:00:05 | host1 | 104.5 | 0 | 0 | NULL |
| 2024-07-11 20:00:05 | host2 | 114 | 0 | 0 | NULL |
| 2024-07-11 20:00:10 | host1 | 4200 | 10 | 4 | 4250 |
| 2024-07-11 20:00:10 | host2 | 111 | 0 | 0 | NULL |
| 2024-07-11 20:00:15 | host1 | 3500 | 4 | 2 | 3100 |
| 2024-07-11 20:00:15 | host2 | 115 | 0 | 0 | NULL |
| 2024-07-11 20:00:20 | host1 | 2500 | 0 | 0 | NULL |
| 2024-07-11 20:00:20 | host2 | 95 | 0 | 0 | NULL |
+---------------------+-------+-------------+------------+------------+-------------------+
8 rows in set (0.02 sec)
```
The picture is clear: **during the `20:00:10` – `20:00:15` window, `host1` experienced p95 latency spikes (up to 4200ms), 10 error logs, and 4 slow trace spans (max 4250ms). `host2` was unaffected**. In a traditional three-pillar stack, this correlation requires switching between Prometheus, Loki, and Jaeger. With GreptimeDB, it's one query.
### Query with PromQL
GreptimeDB natively supports [PromQL](/user-guide/query-data/promql.md). In the Dashboard, switch to the PromQL tab and run:
```promql
quantile_over_time(0.95, grpc_latencies{host!=""}[5s])
```
You can also query via the Prometheus-compatible HTTP API:
```bash
curl -X POST \
-H 'Authorization: Basic {{authorization if exists}}' \
--data-urlencode 'query=quantile_over_time(0.95, grpc_latencies{host!=""}[5s])' \
--data-urlencode 'start=2024-07-11 20:00:00Z' \
--data-urlencode 'end=2024-07-11 20:00:20Z' \
--data-urlencode 'step=15s' \
'http://localhost:4000/v1/prometheus/api/v1/query_range'
```
Output
```json
{
"status": "success",
"data": {
"resultType": "matrix",
"result": [
{
"metric": {
"__name__": "grpc_latencies",
"host": "host1",
"method_name": "GetUser"
},
"values": [
[
1720728015.0,
"3400"
]
]
},
{
"metric": {
"__name__": "grpc_latencies",
"host": "host2",
"method_name": "GetUser"
},
"values": [
[
1720728015.0,
"114"
]
]
}
]
}
}
```
### Mix SQL and PromQL
Use [TQL](/reference/sql/tql.md) to embed PromQL inside SQL — combining the power of both:
```sql
TQL EVAL ('2024-07-11 20:00:00Z', '2024-07-11 20:00:20Z', '15s')
quantile_over_time(0.95, grpc_latencies{host!=""}[5s]);
```
```sql
+---------------------+---------------------------------------------------------+-------+-------------+
| ts | prom_quantile_over_time(ts_range,latency,Float64(0.95)) | host | method_name |
+---------------------+---------------------------------------------------------+-------+-------------+
| 2024-07-11 20:00:15 | 3400 | host1 | GetUser |
| 2024-07-11 20:00:15 | 114 | host2 | GetUser |
+---------------------+---------------------------------------------------------+-------+-------------+
```
You can even use PromQL as a CTE in a correlation query:
```sql
WITH
metrics AS (
TQL EVAL ('2024-07-11 20:00:00Z', '2024-07-11 20:00:20Z', '5s')
quantile_over_time(0.95, grpc_latencies{host!=""}[5s])
),
logs AS (
SELECT
ts, host,
COUNT(log_msg) RANGE '5s' AS num_errors
FROM app_logs
WHERE log_level = 'ERROR'
ALIGN '5s'
)
SELECT
m.*,
COALESCE(l.num_errors, 0) AS num_errors
FROM metrics AS m
LEFT JOIN logs AS l ON m.host = l.host AND m.ts = l.ts
ORDER BY m.ts, m.host;
```
```sql
+---------------------+---------------------------------------------------------+-------+-------------+------------+
| ts | prom_quantile_over_time(ts_range,latency,Float64(0.95)) | host | method_name | num_errors |
+---------------------+---------------------------------------------------------+-------+-------------+------------+
| 2024-07-11 20:00:10 | 140.89999999999998 | host1 | GetUser | 10 |
| 2024-07-11 20:00:10 | 113.8 | host2 | GetUser | 0 |
| 2024-07-11 20:00:15 | 3400 | host1 | GetUser | 4 |
| 2024-07-11 20:00:15 | 114 | host2 | GetUser | 0 |
| 2024-07-11 20:00:20 | 3375 | host1 | GetUser | 0 |
| 2024-07-11 20:00:20 | 115 | host2 | GetUser | 0 |
+---------------------+---------------------------------------------------------+-------+-------------+------------+
```
## GreptimeDB Dashboard
GreptimeDB offers a [Dashboard](./installation/greptimedb-dashboard.md) for data exploration and management.
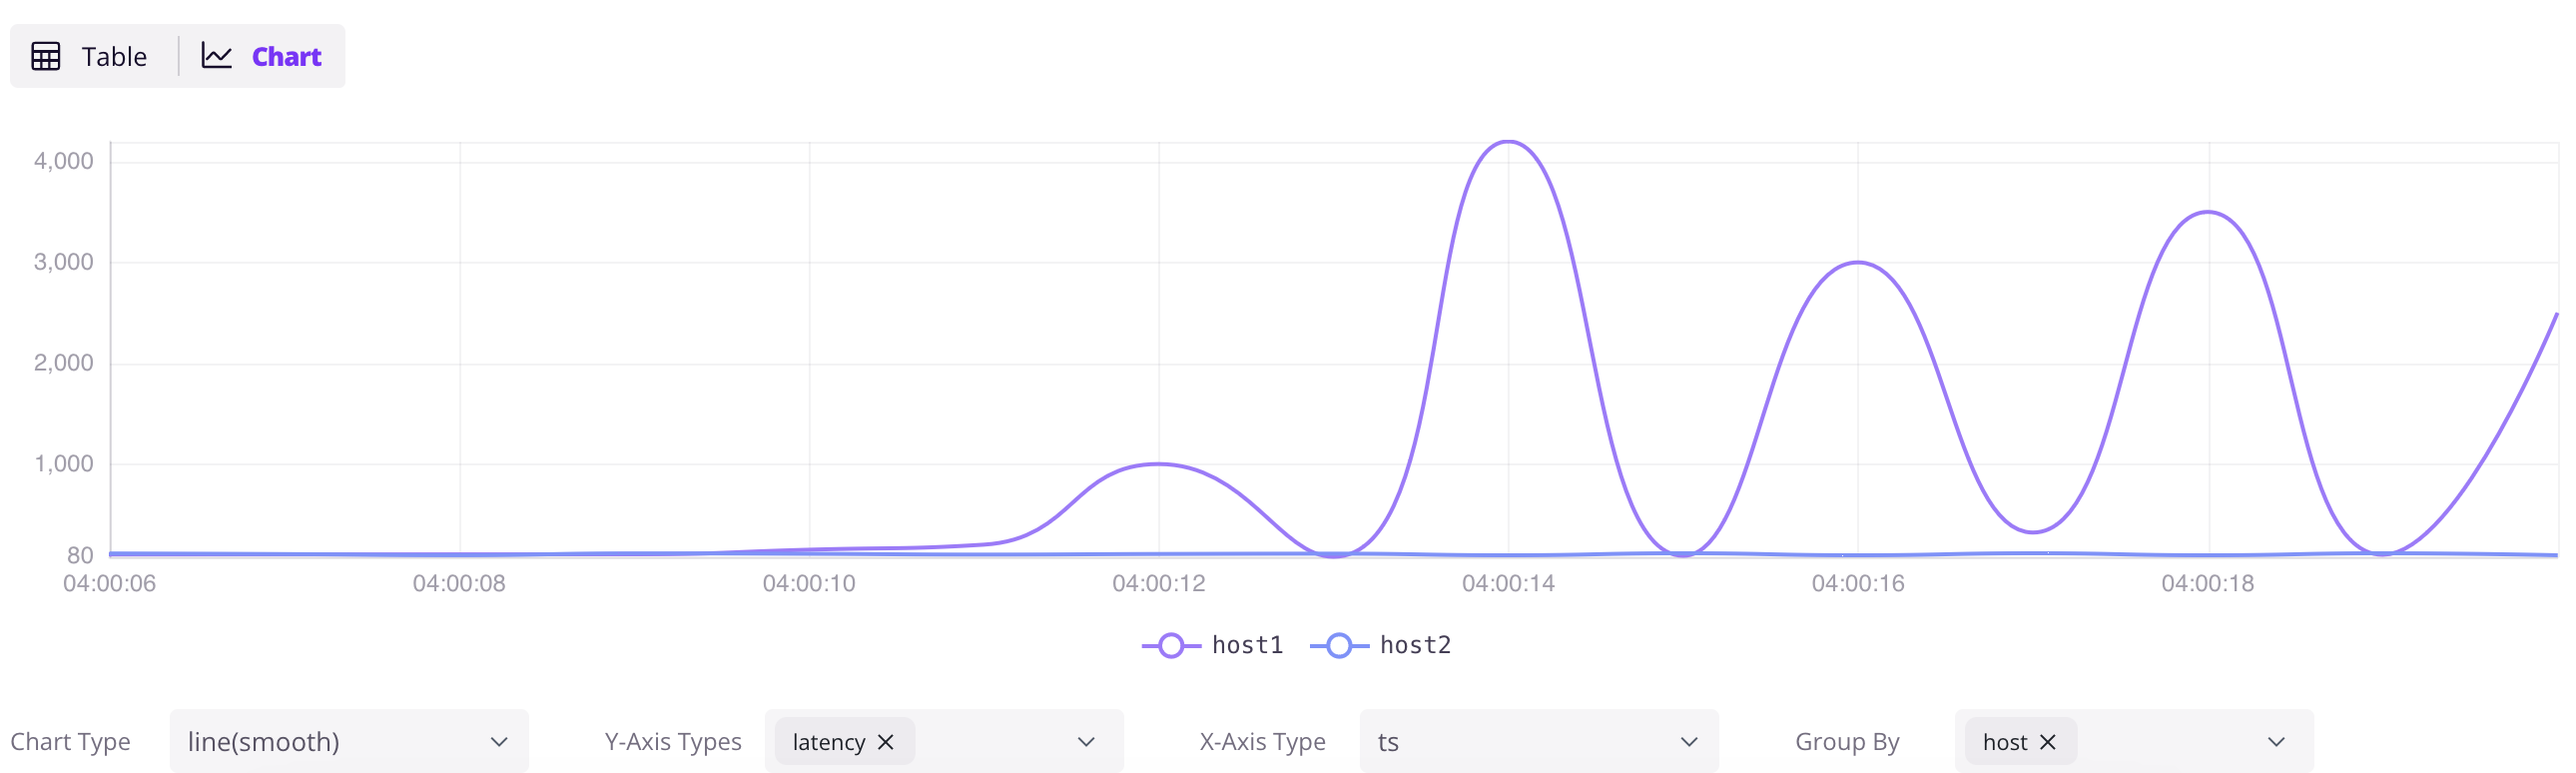
### Explore data
Access the Dashboard at `http://localhost:4000/dashboard`. Click the `+` button to add a query, write SQL, and click `Run All`. Click the `Chart` button in the result panel to visualize the data.
```sql
SELECT * FROM grpc_latencies;
```
### Ingest data by InfluxDB Line Protocol
Click the `Ingest` icon in the Dashboard to write data in [InfluxDB Line Protocol](/user-guide/ingest-data/for-iot/influxdb-line-protocol.md) format. For example:
```txt
grpc_metrics,host=host1,method_name=GetUser latency=100,code=0 1720728021000000000
grpc_metrics,host=host2,method_name=GetUser latency=110,code=1 1720728021000000000
```
Click `Write` to ingest the data. The `grpc_metrics` table is created automatically if it doesn't exist — this is GreptimeDB's [schemaless](/user-guide/ingest-data/overview.md#automatic-schema-generation) capability in action.
## Next steps
**Connect your existing stack:**
- [Prometheus Remote Write](/user-guide/ingest-data/for-observability/prometheus.md) — point your Prometheus at GreptimeDB
- [OpenTelemetry](/user-guide/ingest-data/for-observability/opentelemetry.md) — configure OTel Collector to send metrics, logs, and traces
- [Jaeger](/user-guide/query-data/jaeger.md) — use GreptimeDB as Jaeger's storage backend
- [Loki](/user-guide/ingest-data/for-observability/loki.md) — send logs using Loki protocol
- [Elasticsearch](/user-guide/ingest-data/for-observability/elasticsearch/) — send logs, traces and events using Elasticsearch `_bulk` API
- Find [all ingestion methods](/user-guide/ingest-data/overview/#recommended-data-ingestion-methods).
**Visualize and monitor:**
- [Grafana integration](/user-guide/integrations/grafana.md) — connect Grafana with SQL or PromQL datasource
- [Official Dashboard](/getting-started/installation/greptimedb-dashboard.md) — the embedded dashboard at `http://localhost:4000/dashboard`
**Go deeper:**
- [Why GreptimeDB](/user-guide/concepts/why-greptimedb.md) — architecture, cost comparison, and how GreptimeDB compares
- [Observability 2.0](/user-guide/concepts/observability-2.md) — wide events and the unified data model
- [Demo scene](https://github.com/GreptimeTeam/demo-scene/) — more hands-on examples
- [User Guide](/user-guide/overview.md) — complete reference