Quick Start Example
This section walks through an end-to-end example that uses Trigger to monitor system load and raise an alert.
The diagram illustrates the complete end-to-end workflow of the example.
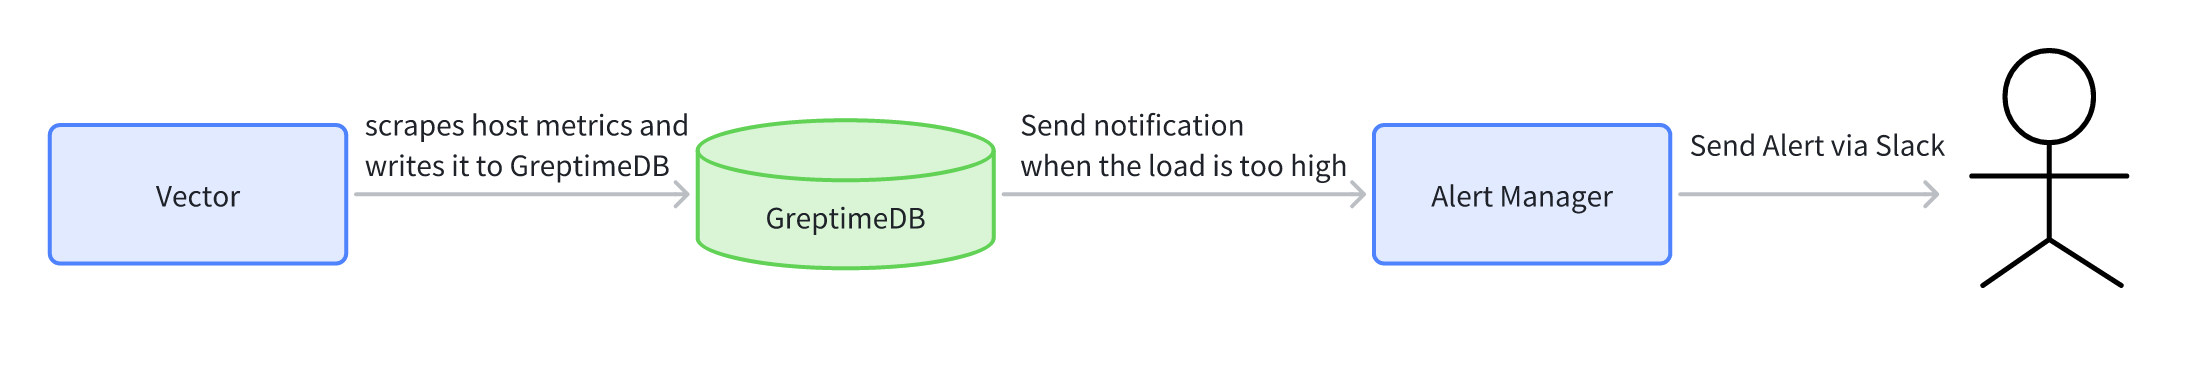
- Vector continuously scrapes host metrics and writes them to GreptimeDB.
- A Trigger in GreptimeDB evaluates a rule every minute; whenever the condition is met, it sends a notification to Alertmanager.
- Alertmanager applies its own policies and finally delivers the alert to Slack.
Use Vector to Scrape Host Metrics
Use Vector to scrape host metrics and write it to GreptimeDB. Below is a Vector configuration example:
[sources.in]
type = "host_metrics"
scrape_interval_secs = 15

[sinks.out]
inputs = ["in"]
type = "greptimedb"
endpoint = "localhost:4001"
GreptimeDB auto-creates tables on the first write. The host_load1 table stores
the system load averaged over the last minute. It is a key performance indicator
for measuring system activity. We can create a monitoring rule to track values
in this table. The schema of this table is shown below:
+-----------+----------------------+------+------+---------+---------------+
| Column    | Type                 | Key  | Null | Default | Semantic Type |
+-----------+----------------------+------+------+---------+---------------+
| ts        | TimestampMillisecond | PRI  | NO   |         | TIMESTAMP     |
| collector | String               | PRI  | YES  |         | TAG           |
| host      | String               | PRI  | YES  |         | TAG           |
| val       | Float64              |      | YES  |         | FIELD         |
+-----------+----------------------+------+------+---------+---------------+
Set up Alertmanager with a Slack Receiver
The payload of GreptimeDB Trigger's Webhook is compatible with Prometheus Alertmanager, so we can reuse Alertmanager’s grouping, inhibition, silencing and routing features without any extra glue code.
You can refer to the official documentation to configure Prometheus Alertmanager. Below is a minimal message template you can use:
{{ define "slack.text" }}
{{ range .Alerts }}

Labels:
{{- range .Labels.SortedPairs }}
- {{ .Name }}: {{ .Value }}
{{ end }}

Annotations:
{{- range .Annotations.SortedPairs }}
- {{ .Name }}: {{ .Value }}
{{ end }}

{{ end }}
{{ end }}
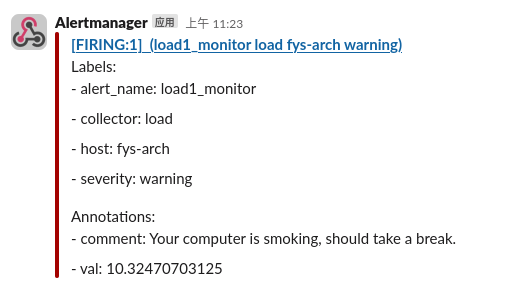
Generating a Slack message using the above template will iterate over all alerts and display the labels and annotations for each alert.
Start Alertmanager once the configuration is ready.
Create Trigger
Connect to GreptimeDB with MySql client and run the following SQL:
CREATE TRIGGER IF NOT EXISTS load1_monitor
        ON (
                SELECT collector AS label_collector,
                host as label_host,
                val
                FROM host_load1 WHERE val > 10 and ts >= now() - '1 minutes'::INTERVAL
        ) EVERY '1 minute'::INTERVAL
        LABELS (severity=warning)
        ANNOTATIONS (comment='Your computer is smoking, should take a break.')
        NOTIFY(
                WEBHOOK alert_manager URL 'http://localhost:9093' WITH (timeout="1m")
        );
The above SQL will create a trigger named load1_monitor that runs every minute.
It evaluates the last 60 seconds of data in host_load1; if any load1 value
exceeds 10, the WEBHOOK option in the NOTIFY syntax specifies that this
trigger will send a notification to Alertmanager which running on localhost with
port 9093.
You can execute SHOW TRIGGERS to view the list of created Triggers.
SHOW TRIGGERS;
The output should look like this:
+---------------+
| Triggers      |
+---------------+
| load1_monitor |
+---------------+
Test Trigger
Use stress-ng to simulate high CPU load for 60s:
stress-ng --cpu 100 --cpu-load 10 --timeout 60
The load1 will rise quickly, the Trigger notification will fire, and within a minute Slack channel will receive an alert like: