Continuous Profiling
Continuous Profiling in the Management Console monitors GreptimeDB component resource usage and stores pprof-format memory and CPU profiles in the monitoring GreptimeDB instance. It helps operators investigate memory growth, high CPU usage, and performance regressions without manually logging in to each component.
The Continuous Profiling UI is available starting from dashboard version v0.2.0-alpha.8.
Continuous Profiling is configured on the dashboard apiserver and works at the cluster level. When enabled, the monitor scans component series from cluster metrics, captures the first seen component, and captures later profiles when resource usage grows by the configured step or reaches a new high above the configured threshold.
Memory Profiles
Enable memory profile monitoring in the dashboard apiserver configuration:
monitoring:
  greptimedb:
    url: http://monitoring-greptimedb:4000
  memory_profile:
    enabled: true
    memory_profiles_database: public
    memory_profiles_table: _gt_memory_profiles
    memory_profile_step_mb: 100
    high_memory_threshold_mb: 1024
Memory profile configuration items:
enabled: Enables or disables memory profile monitoring.memory_profiles_database: Database that stores captured memory profiles. The default ispublic.memory_profiles_table: Table that stores captured memory profiles. The default is_gt_memory_profiles.memory_profile_step_mb: Memory growth step, in MB, that triggers a new profile capture after the first capture.high_memory_threshold_mb: High-memory threshold, in MB. When memory usage is above this value, each new memory high watermark triggers a profile capture. Set it to0to disable high-memory capture.
The profile table defaults to public._gt_memory_profiles and is created with a default TTL of 30 days. The monitor uses memory usage, memory limit, and process start time metrics to decide when to capture a new profile.
The target GreptimeDB process must start with jemalloc memory profiling enabled, as described in Memory profiling. For command-line deployments on Linux, start the process with MALLOC_CONF=prof:true:
MALLOC_CONF=prof:true ./greptime standalone start
For Helm deployments, add the environment variable to the target role, or to base.podTemplate.main.env to apply it to all GreptimeDB roles:
base:
  podTemplate:
    main:
      env:
        - name: MALLOC_CONF
          value: "prof:true"
The Management Console lists captured memory profiles with filters for Pod, App, Role, and time range. Use Capture to manually capture a profile for a component when you need an on-demand snapshot.
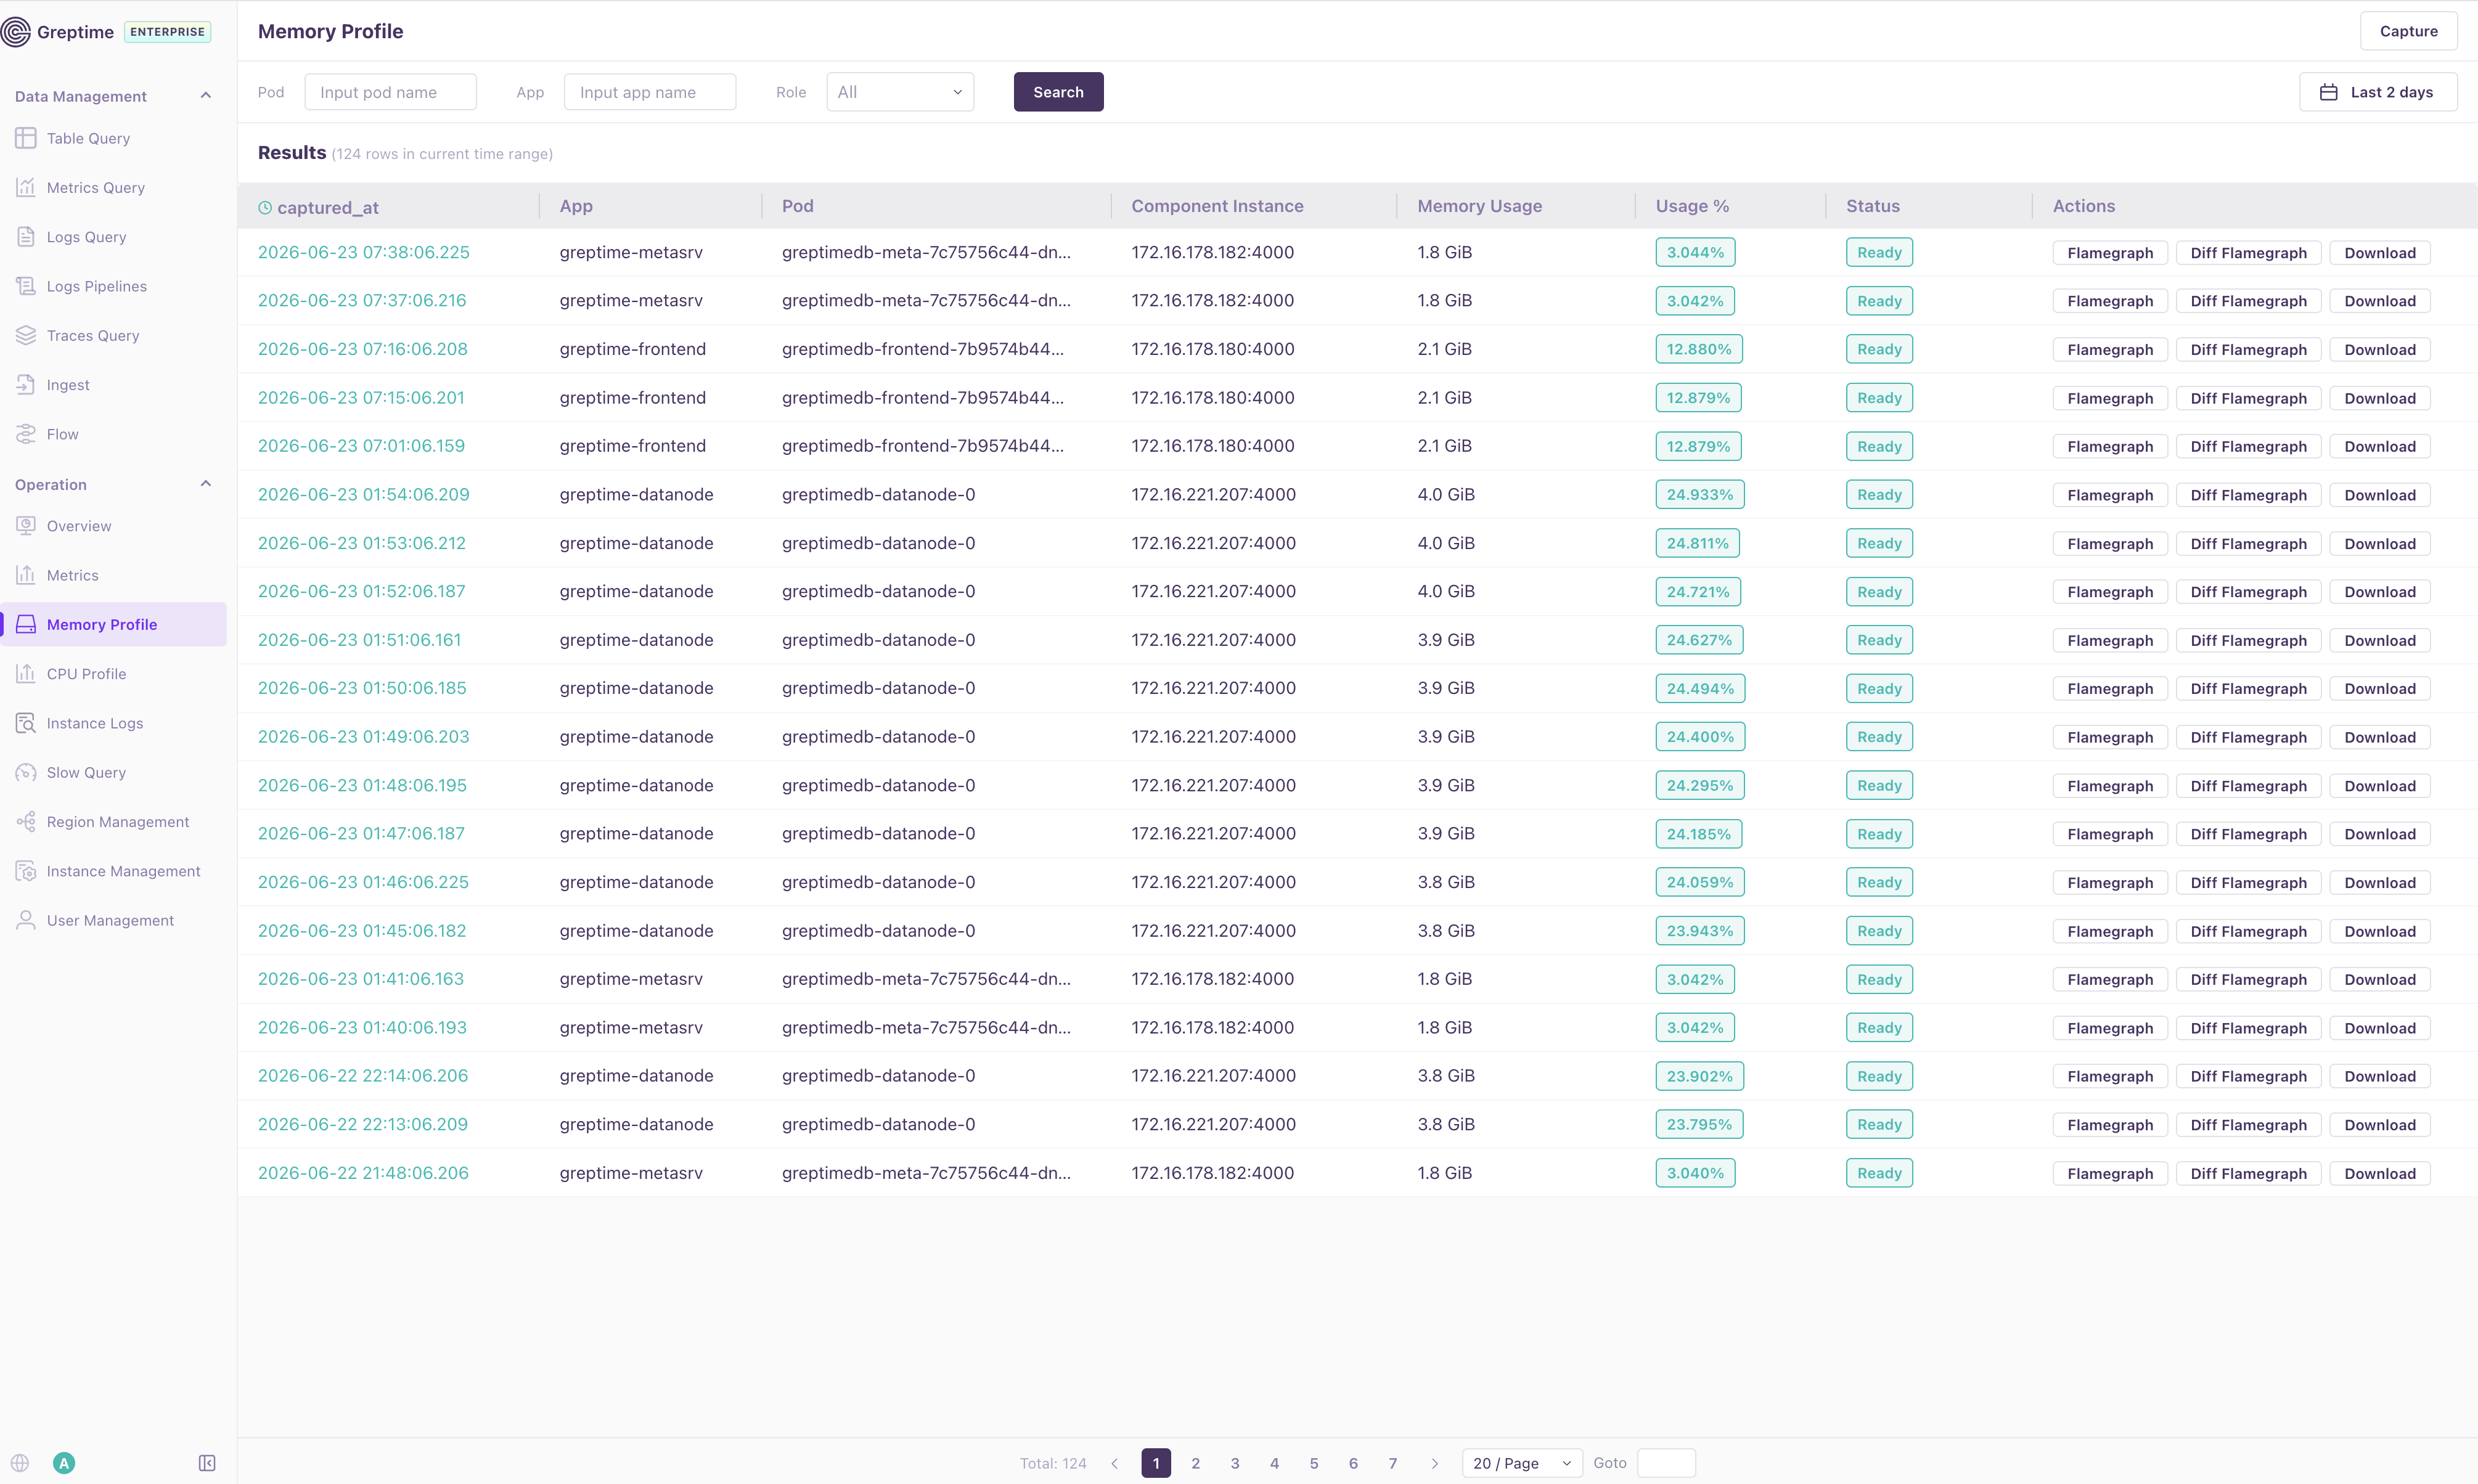
The table shows when the profile was captured, the component App and Pod, the component endpoint, memory usage, usage percentage, and profile status. Use the row actions to open a flamegraph, compare the profile with a base profile, or download the raw pprof file for offline analysis.
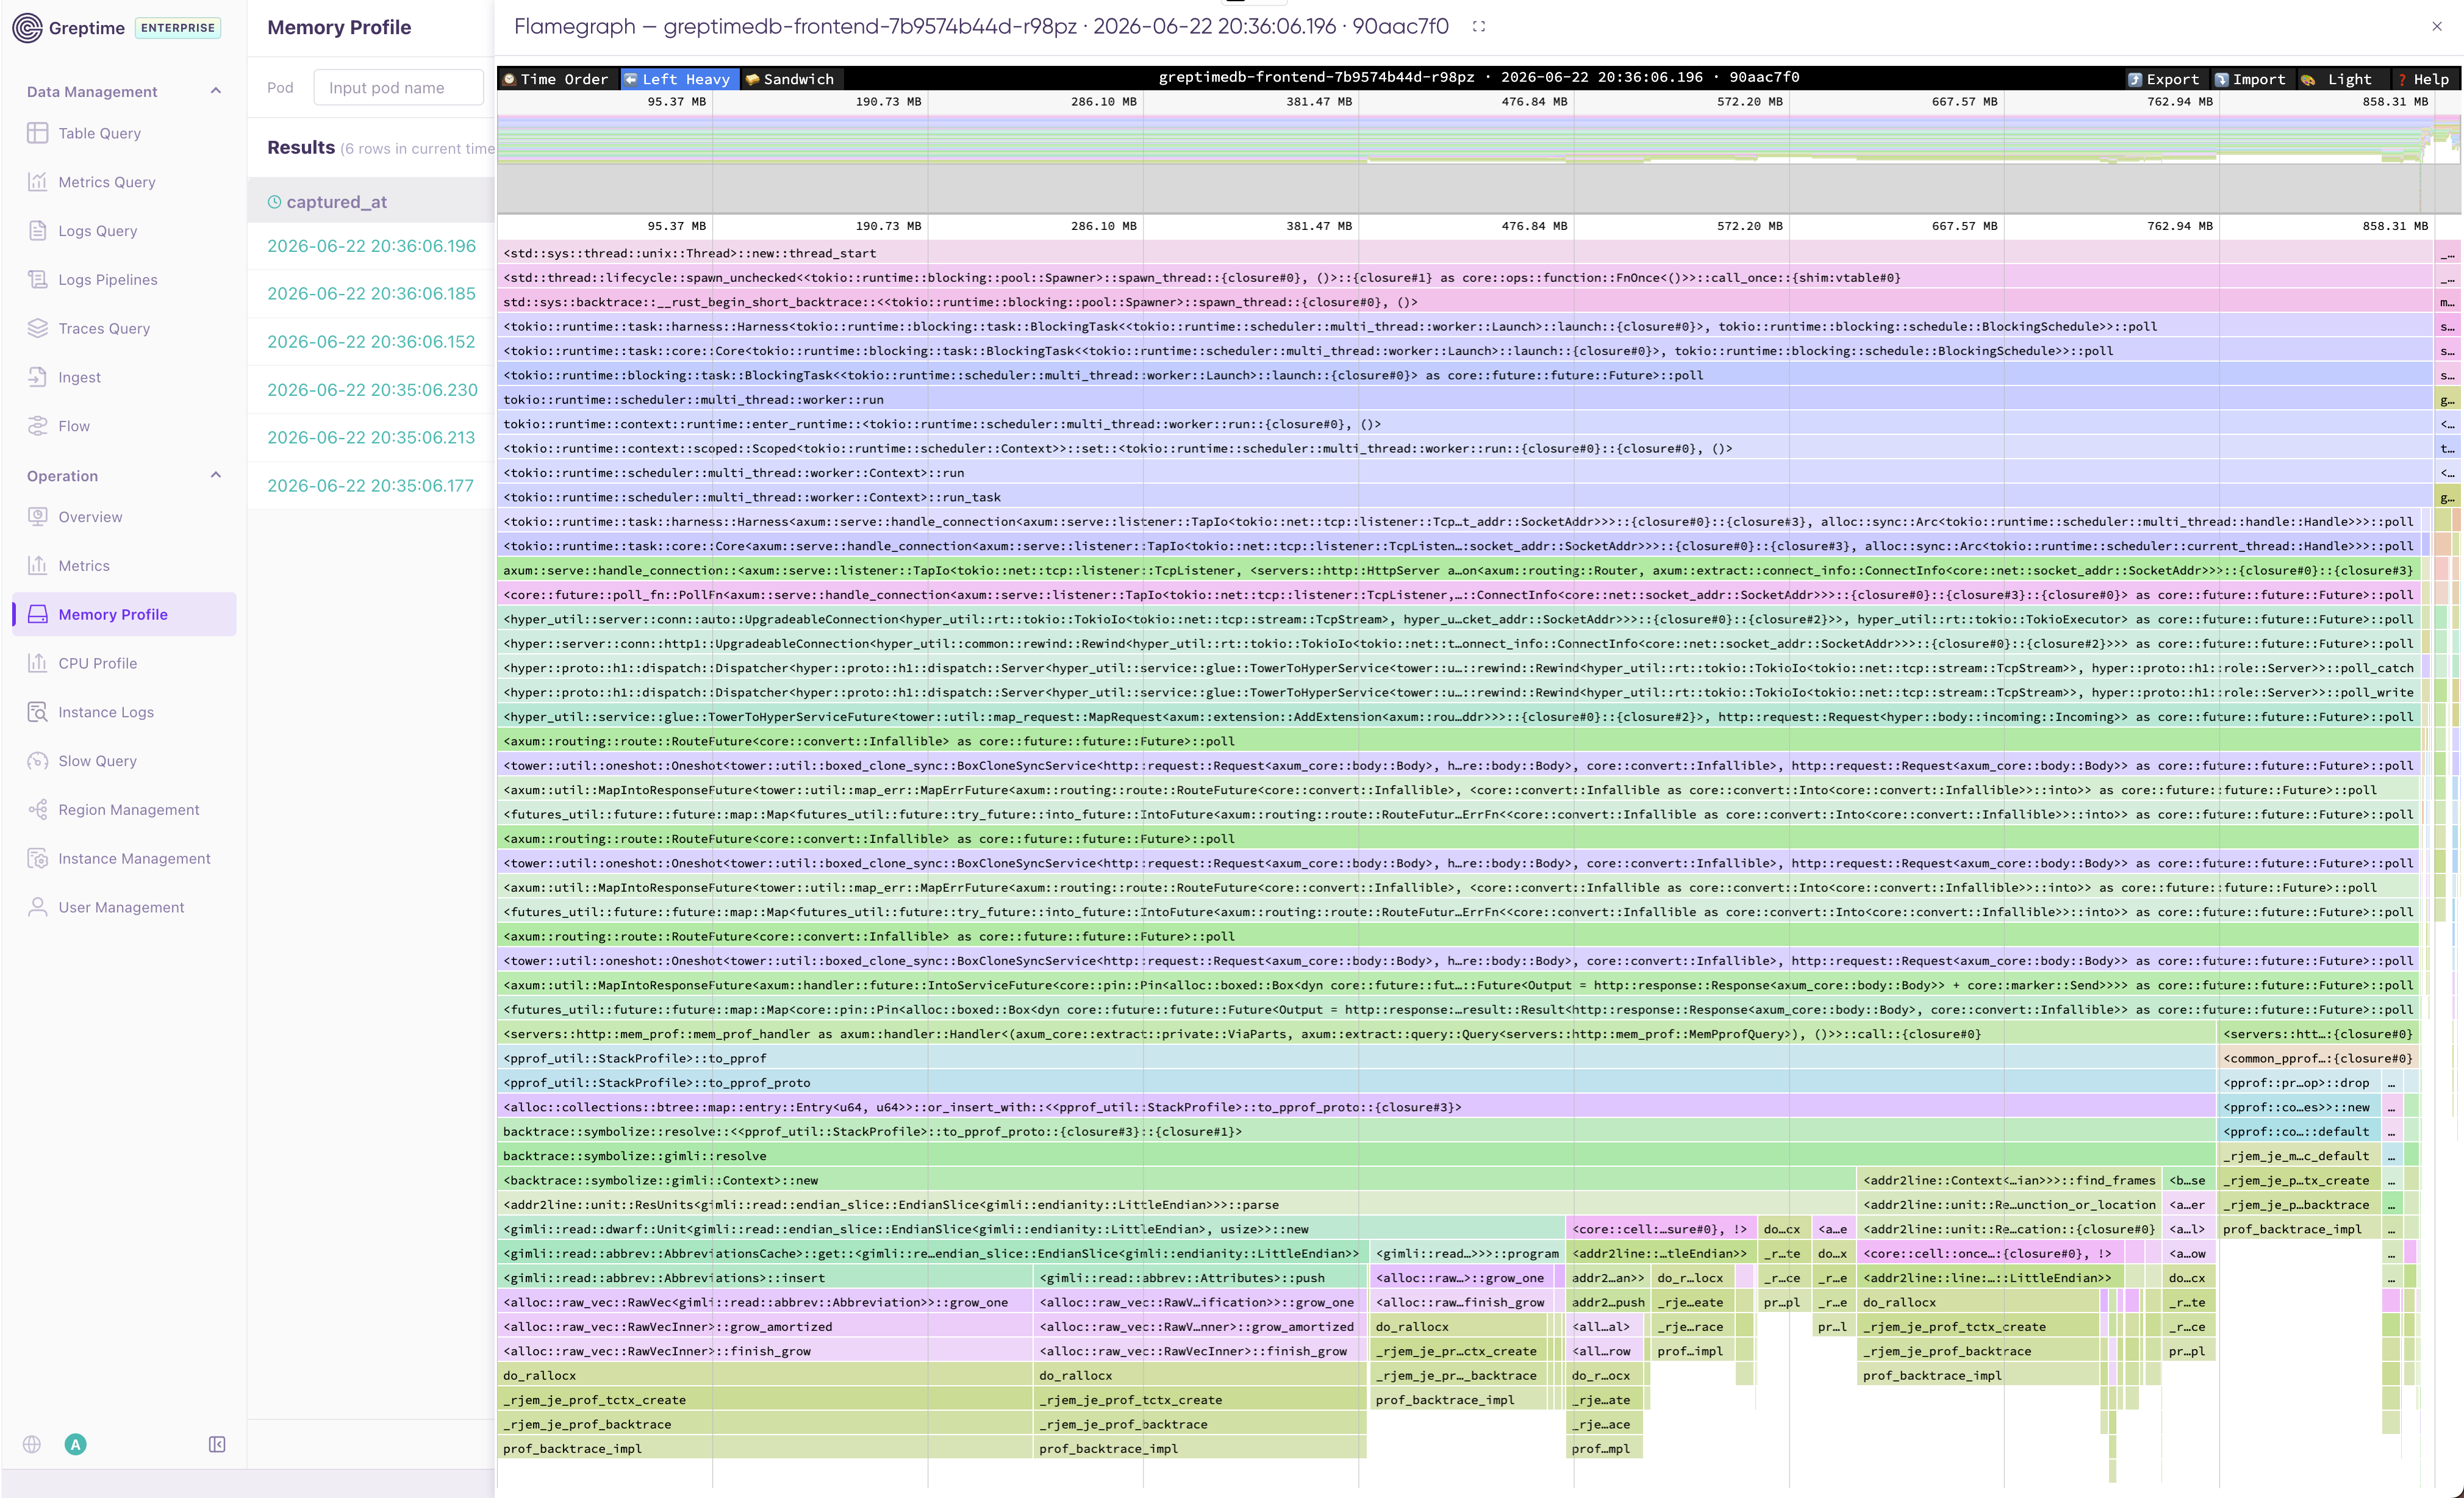
The flamegraph view renders a captured profile in the browser. The top toolbar supports common pprof interactions such as ordering, switching between Left Heavy and Sandwich views, importing and exporting profile data, and adjusting the display theme.
CPU Profiles
Enable CPU profile monitoring in the dashboard apiserver configuration:
monitoring:
  greptimedb:
    url: http://monitoring-greptimedb:4000
  cpu_profile:
    enabled: true
    cpu_profiles_database: public
    cpu_profiles_table: _gt_cpu_profiles
    cpu_profile_step_millicores: 100
    high_cpu_threshold_millicores: 800
    seconds: 5
    frequency: 99
CPU profile configuration items:
enabled: Enables or disables CPU profile monitoring.cpu_profiles_database: Database that stores captured CPU profiles. The default ispublic.cpu_profiles_table: Table that stores captured CPU profiles. The default is_gt_cpu_profiles.cpu_profile_step_millicores: CPU usage growth step, in millicores, that triggers a new profile capture after the first capture.high_cpu_threshold_millicores: High-CPU threshold, in millicores. When CPU usage is above this value, each new CPU high watermark triggers a profile capture. Set it to0to disable high-CPU capture.seconds: CPU profiling duration, in seconds, for each capture.frequency: CPU profiling sampling frequency, in Hz.
The profile table defaults to public._gt_cpu_profiles and is created with a default TTL of 30 days. The monitor uses CPU usage, CPU limit, and process start time metrics to decide when to capture a new profile.
The CPU Profile page follows the same interaction pattern as Memory Profile. Use Pod, App, Role, and time range filters to find profile records. Use Capture for an on-demand CPU profile, and use row actions to open the flamegraph or download the raw pprof file for offline analysis.
Manual capture ignores threshold state but still requires the pod to be discoverable from the corresponding CPU metrics.