Management Console
The GreptimeDB Enterprise Management Console is an enhanced version of the standard GreptimeDB dashboard, designed specifically for enterprise users who require advanced cluster observability and operational capabilities. It provides comprehensive monitoring, management, and operational tools that go beyond the standard dashboard functionality.
Overview
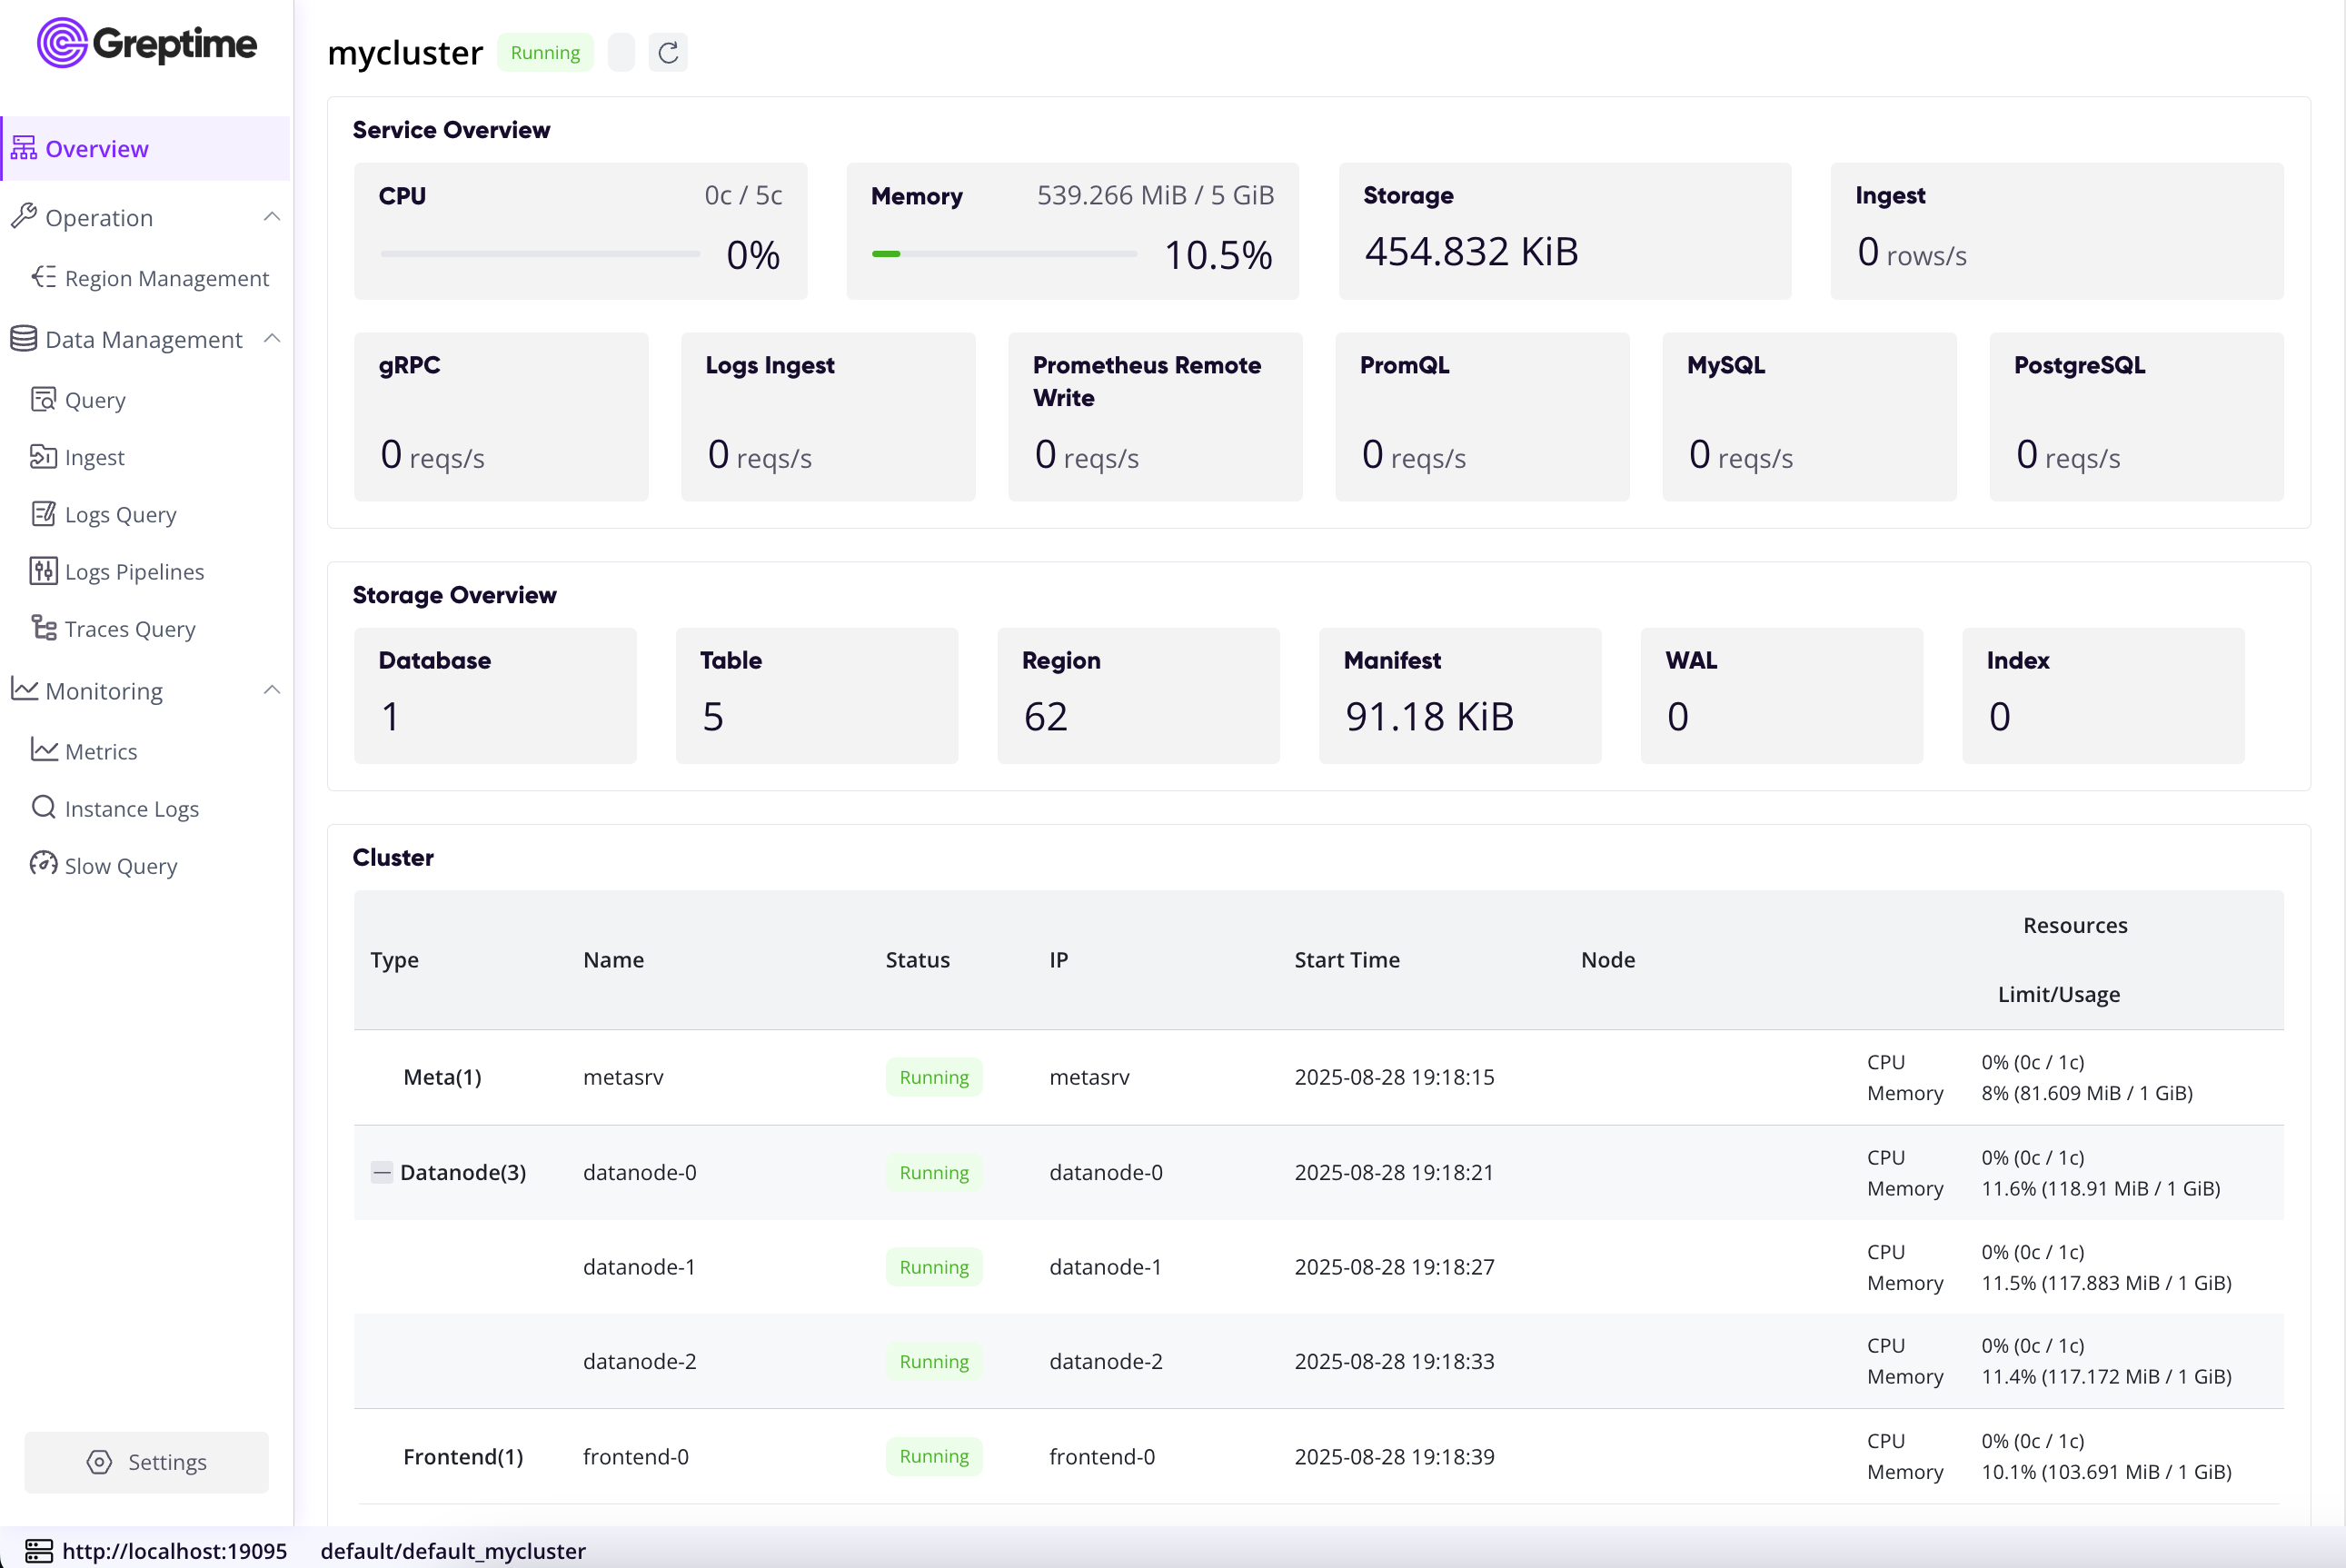
The Overview page displays the overall cluster status and resource usage.
- Service Overview: CPU, memory, and storage usage; data ingestion rate; request rates by protocol.
- Storage Overview: Number of databases, tables, and regions; sizes of Manifest, WAL, and Index files.
- Cluster: Node types; node status and resource usage.
Region Management
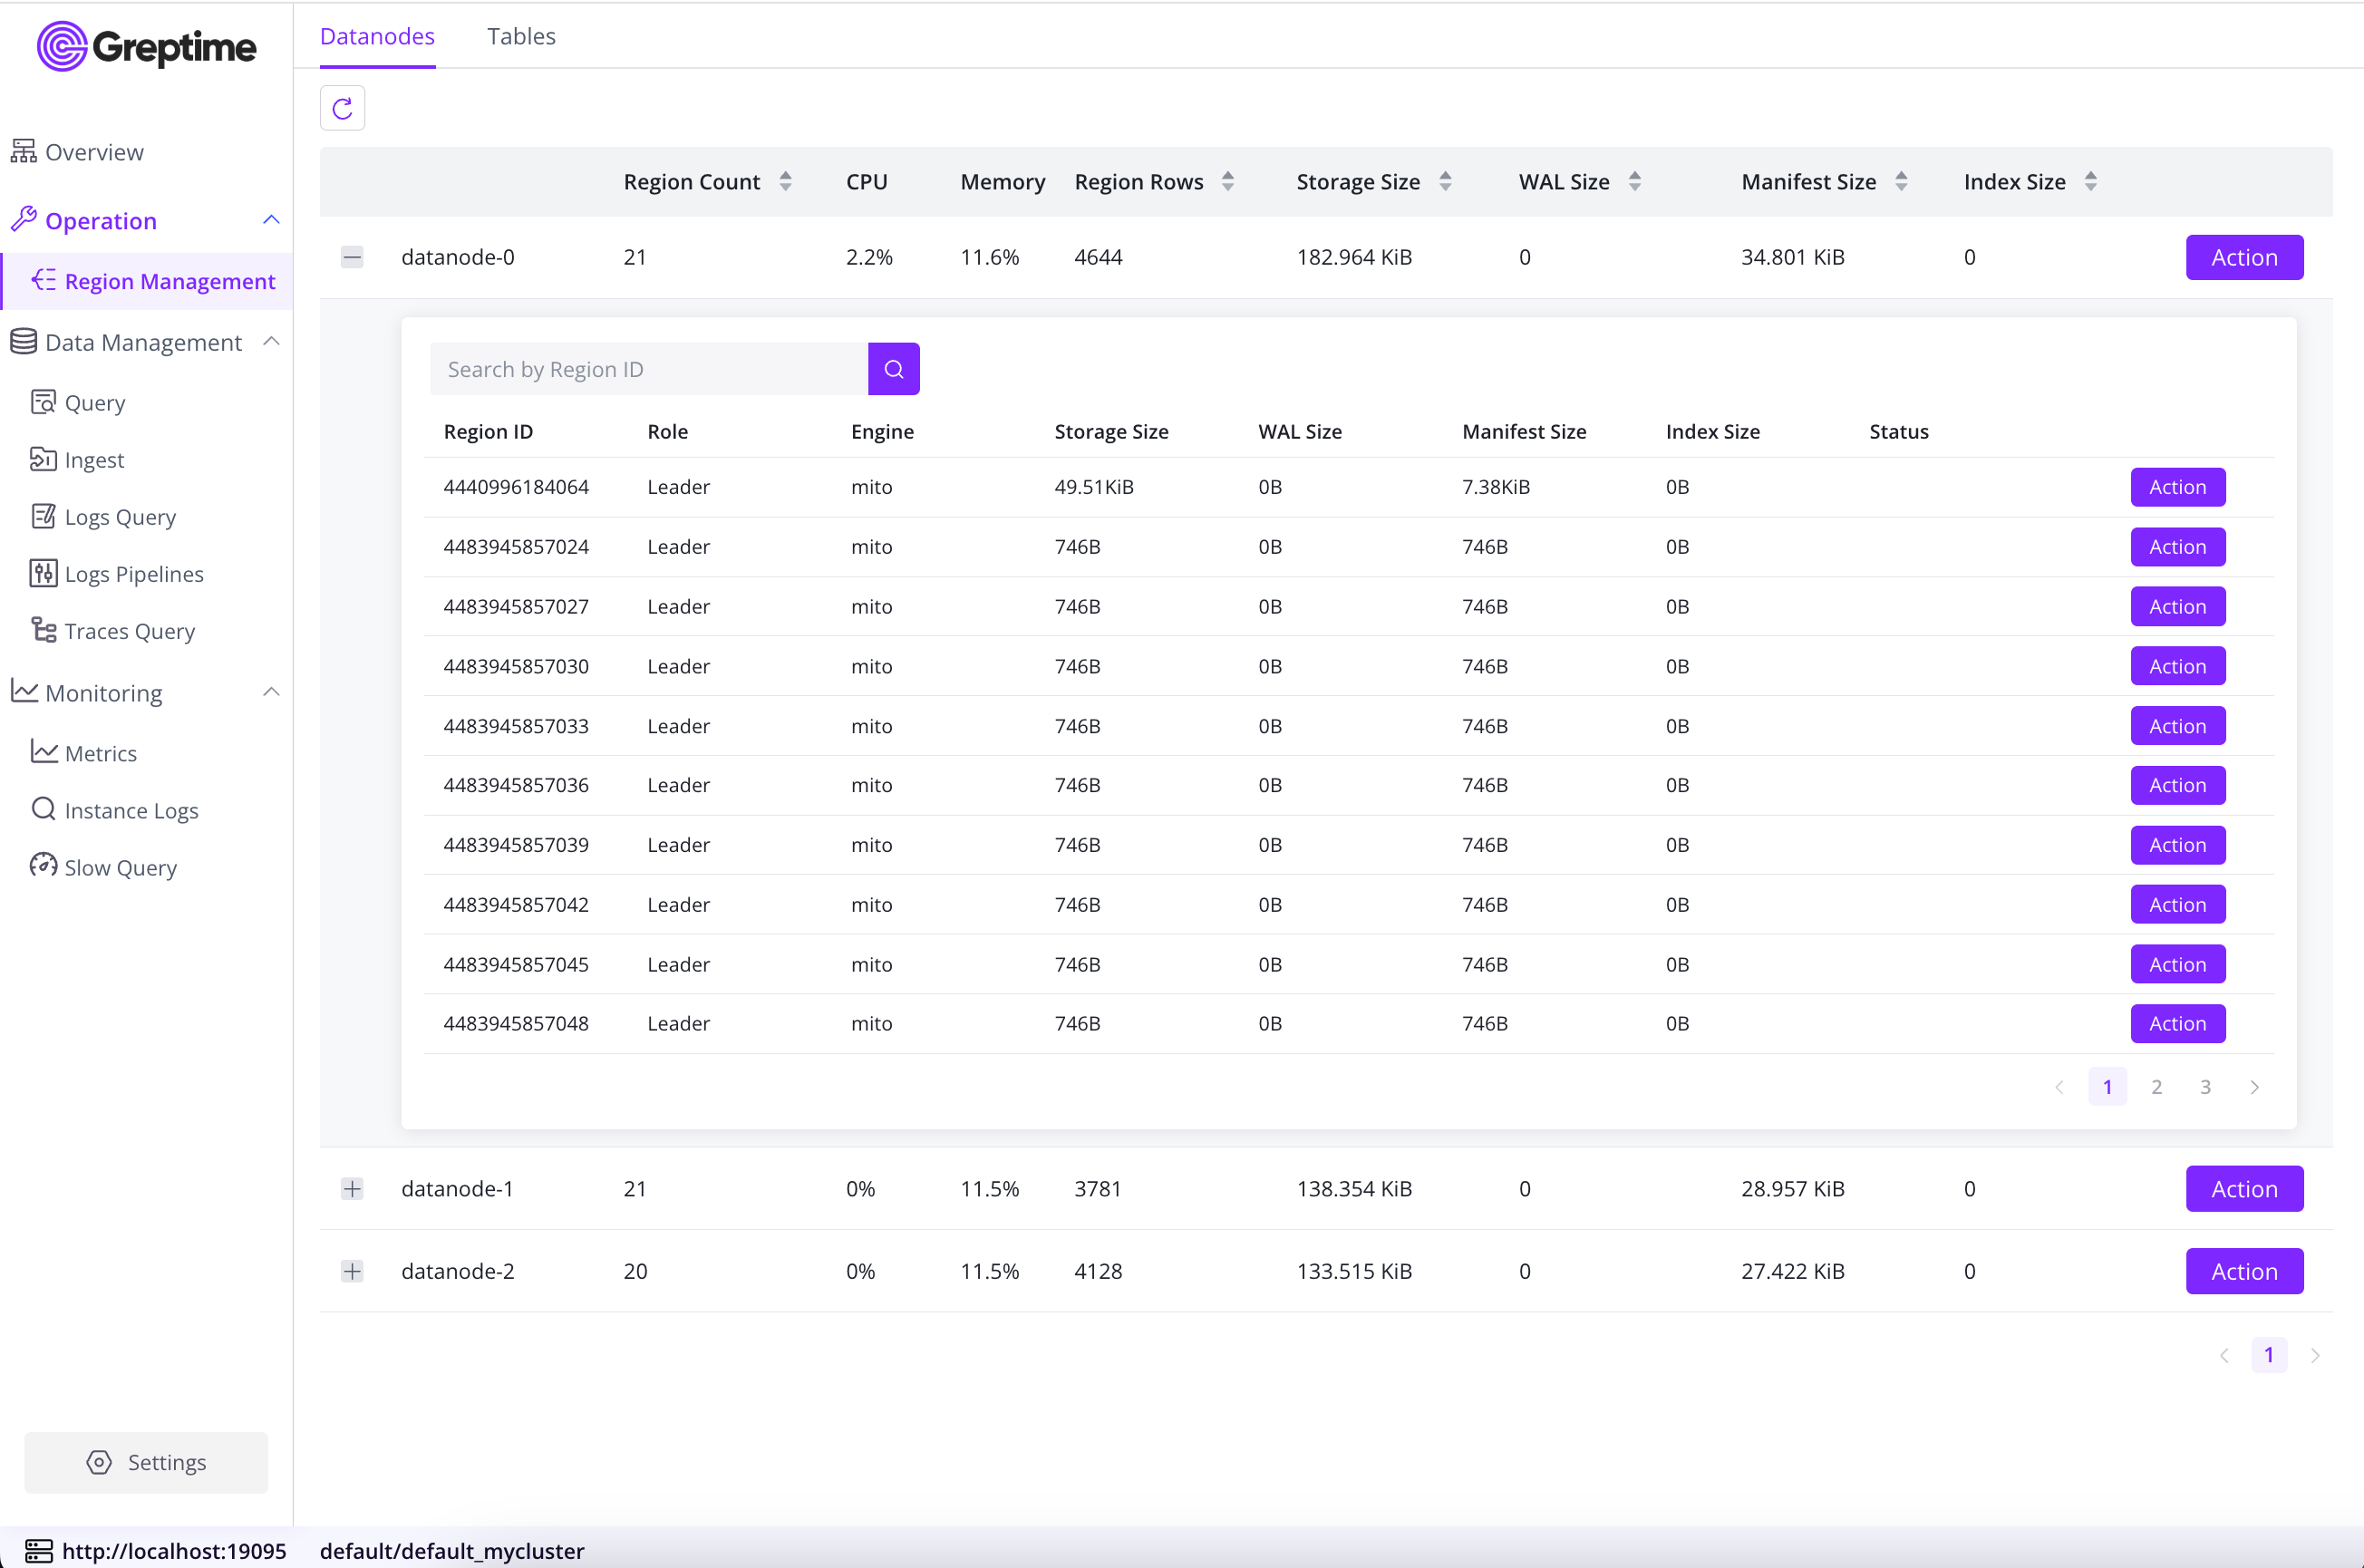
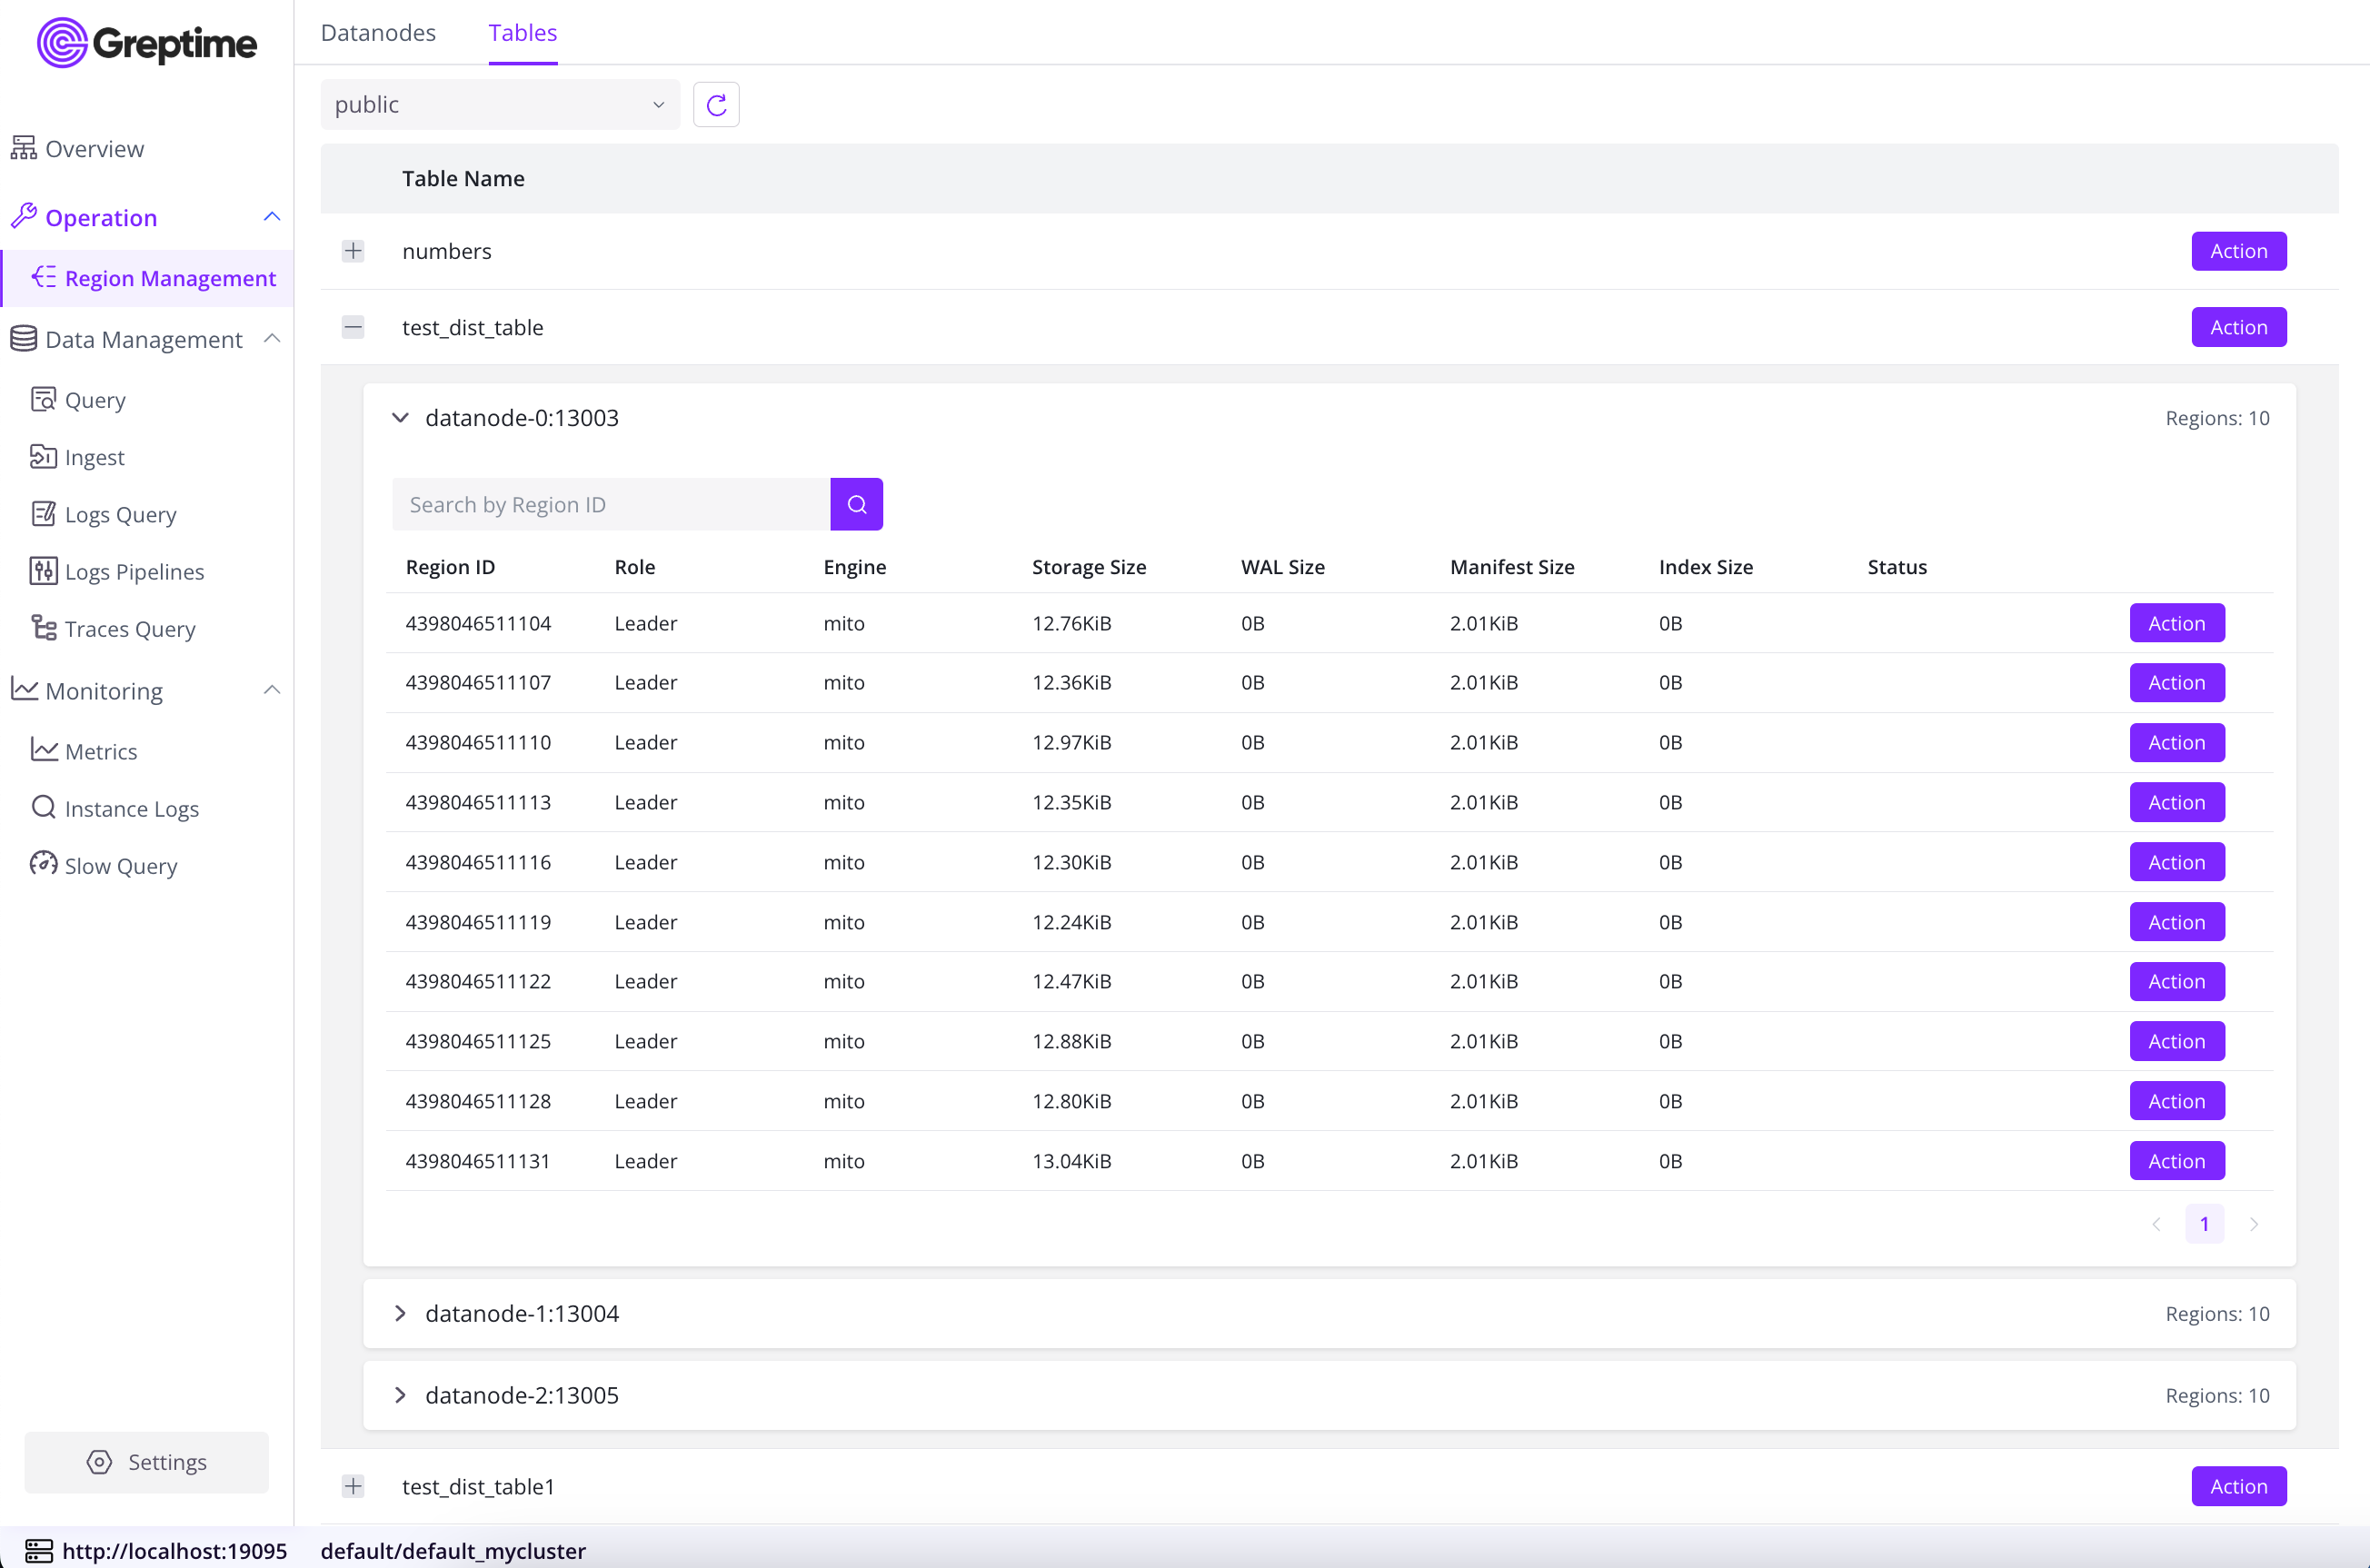
Region Management provides region-level operational capabilities for advanced cluster administration.
- Datanodes view: View details of each datanode and its regions, including region ID, associated table, storage size, WAL/Manifest/Index usage, and row count.
- Tables view: View region distribution by table with expandable region details for comprehensive analysis.
- Region maintenance: Execute Flush and Compact operations to optimize storage and performance.
- Region migration: Migrate regions between nodes with configurable timeout settings and real-time progress tracking.
Data Management
The Data Management page provides SQL/PromQL queries, data ingestion, logs queries, logs pipelines, traces queries, and Flow management. These features are consistent with the open-source Dashboard and Cloud Dashboard.
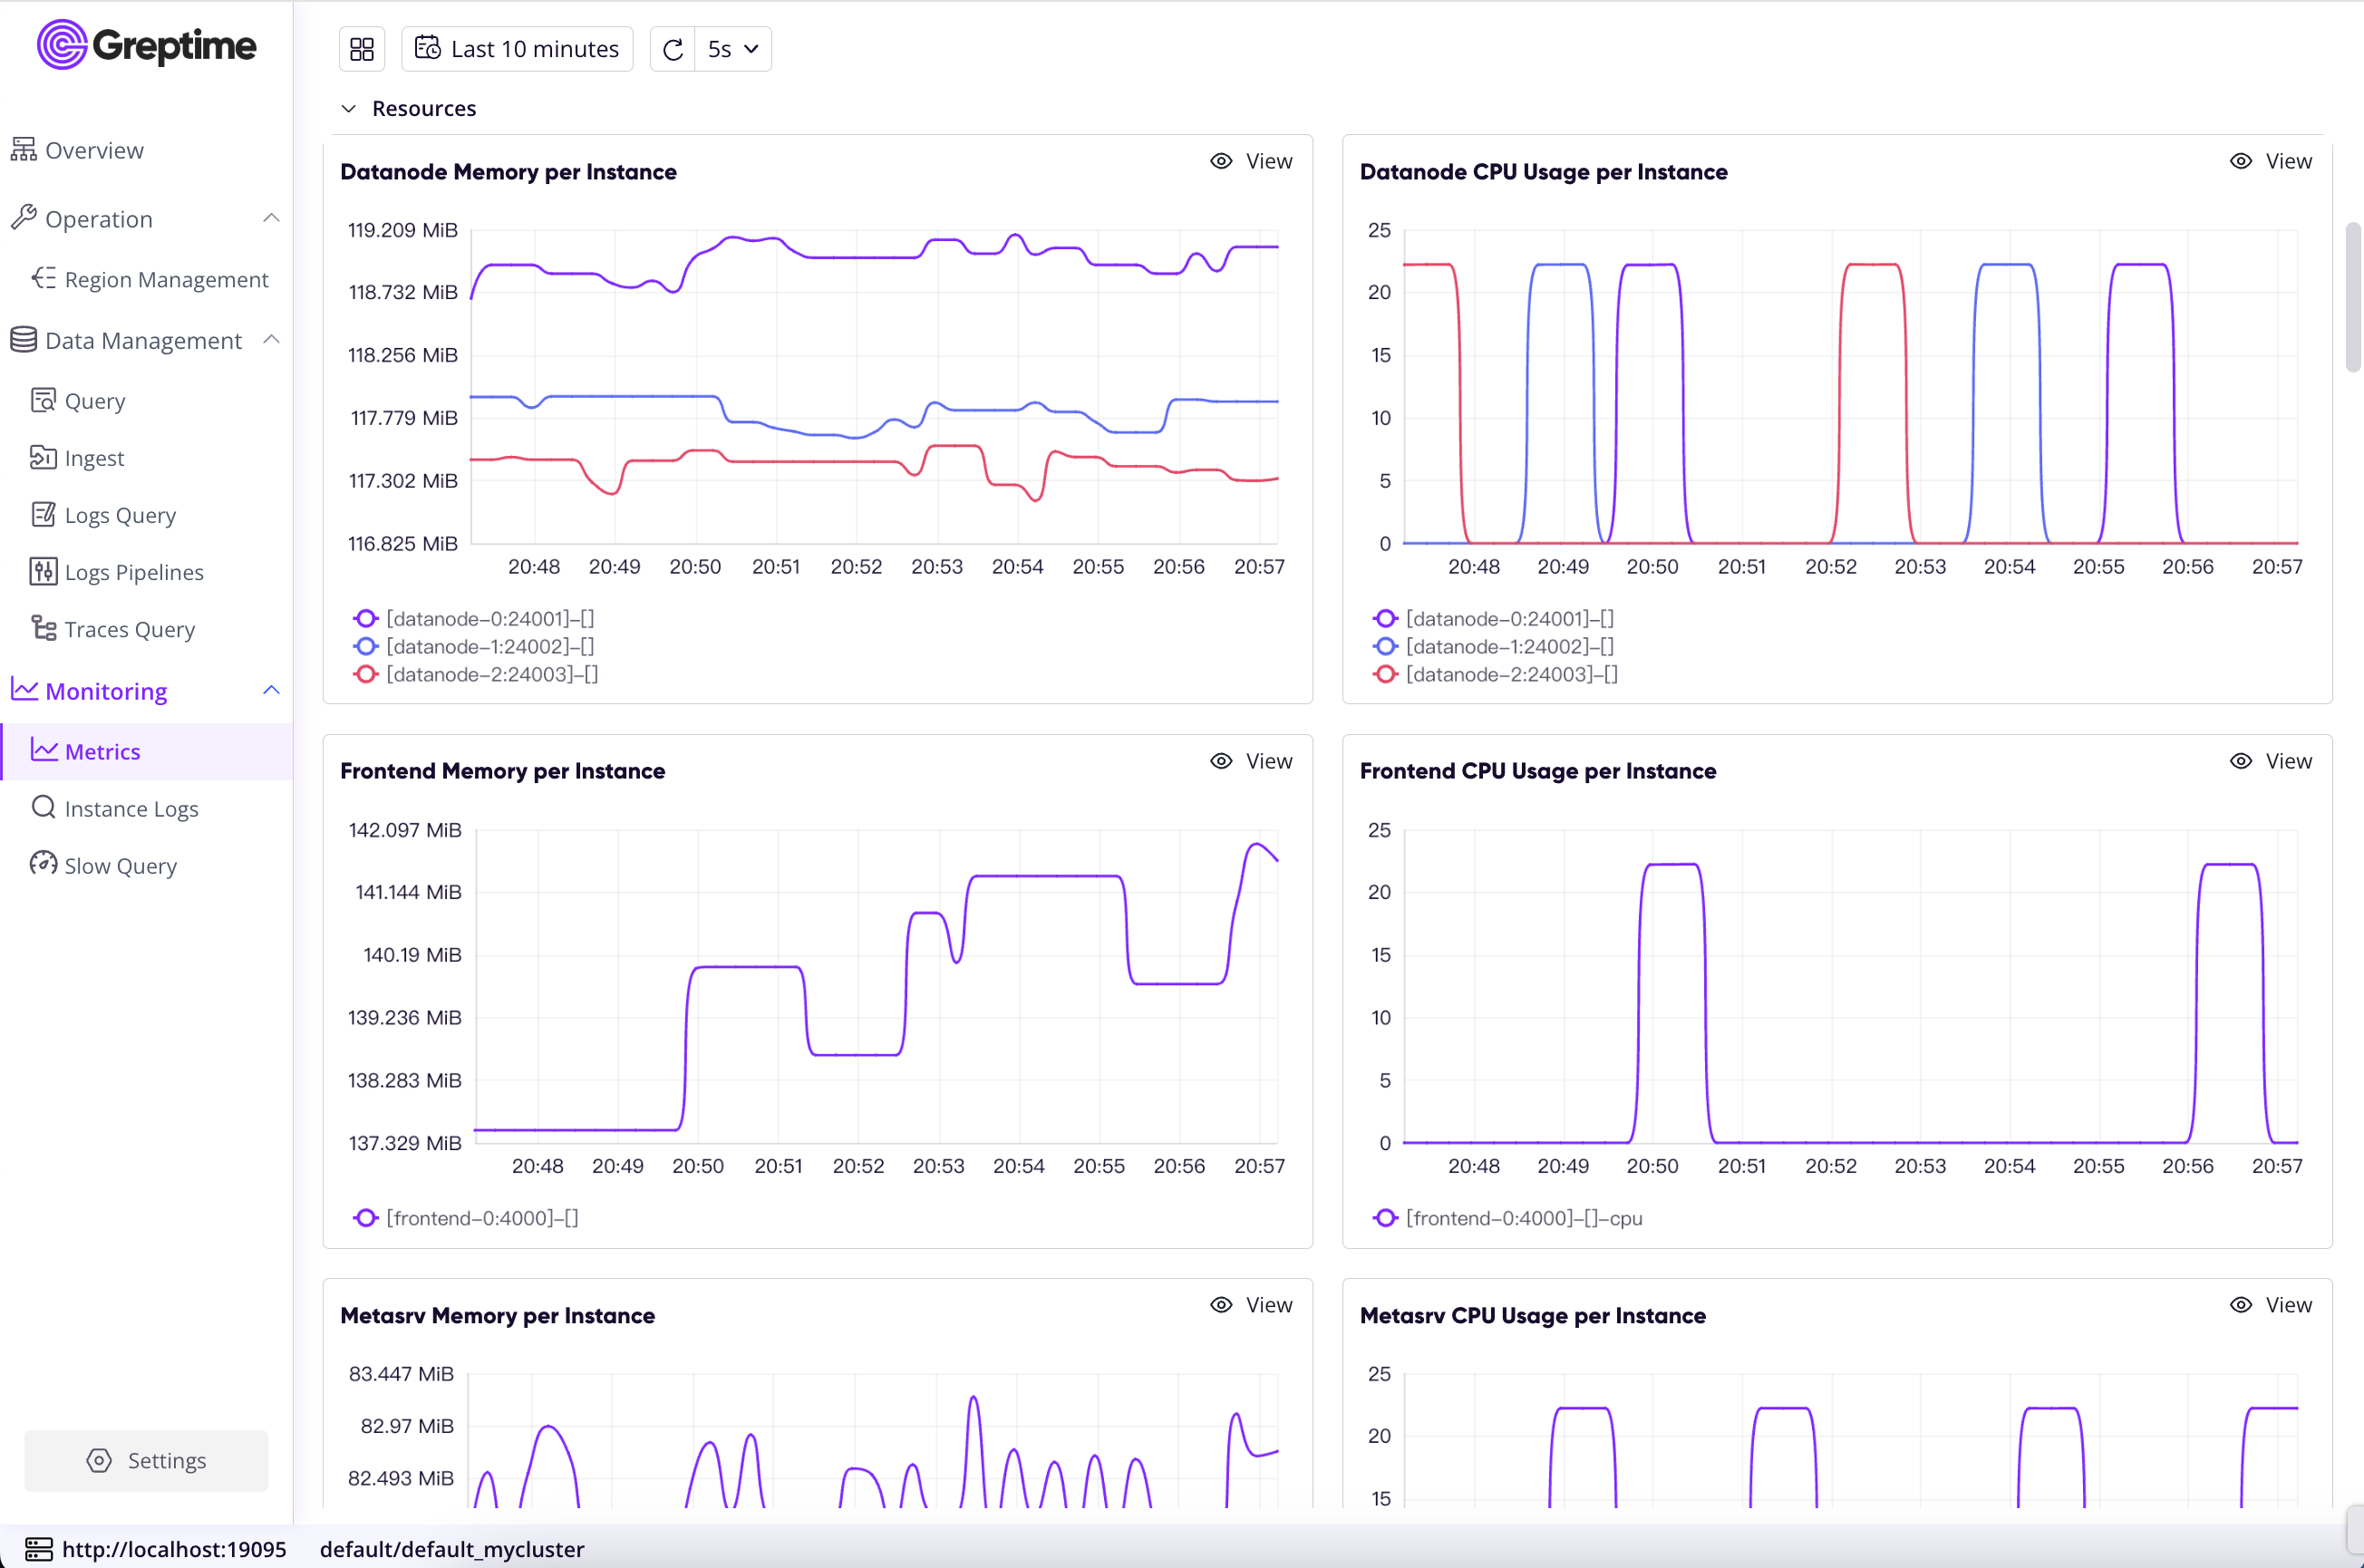
Monitoring
The Monitoring page provides comprehensive metrics and log monitoring capabilities for enterprise-grade observability.
Metrics
Provides multiple groups of monitoring panels including Overview, Ingestion, Queries, Resources, Frontend Requests, Frontend to Datanode, Mito Engine, OpenDAL, Metasrv, and Flownode. These panels cover essential cluster metrics such as operational status, request rates, latency, and resource utilization.
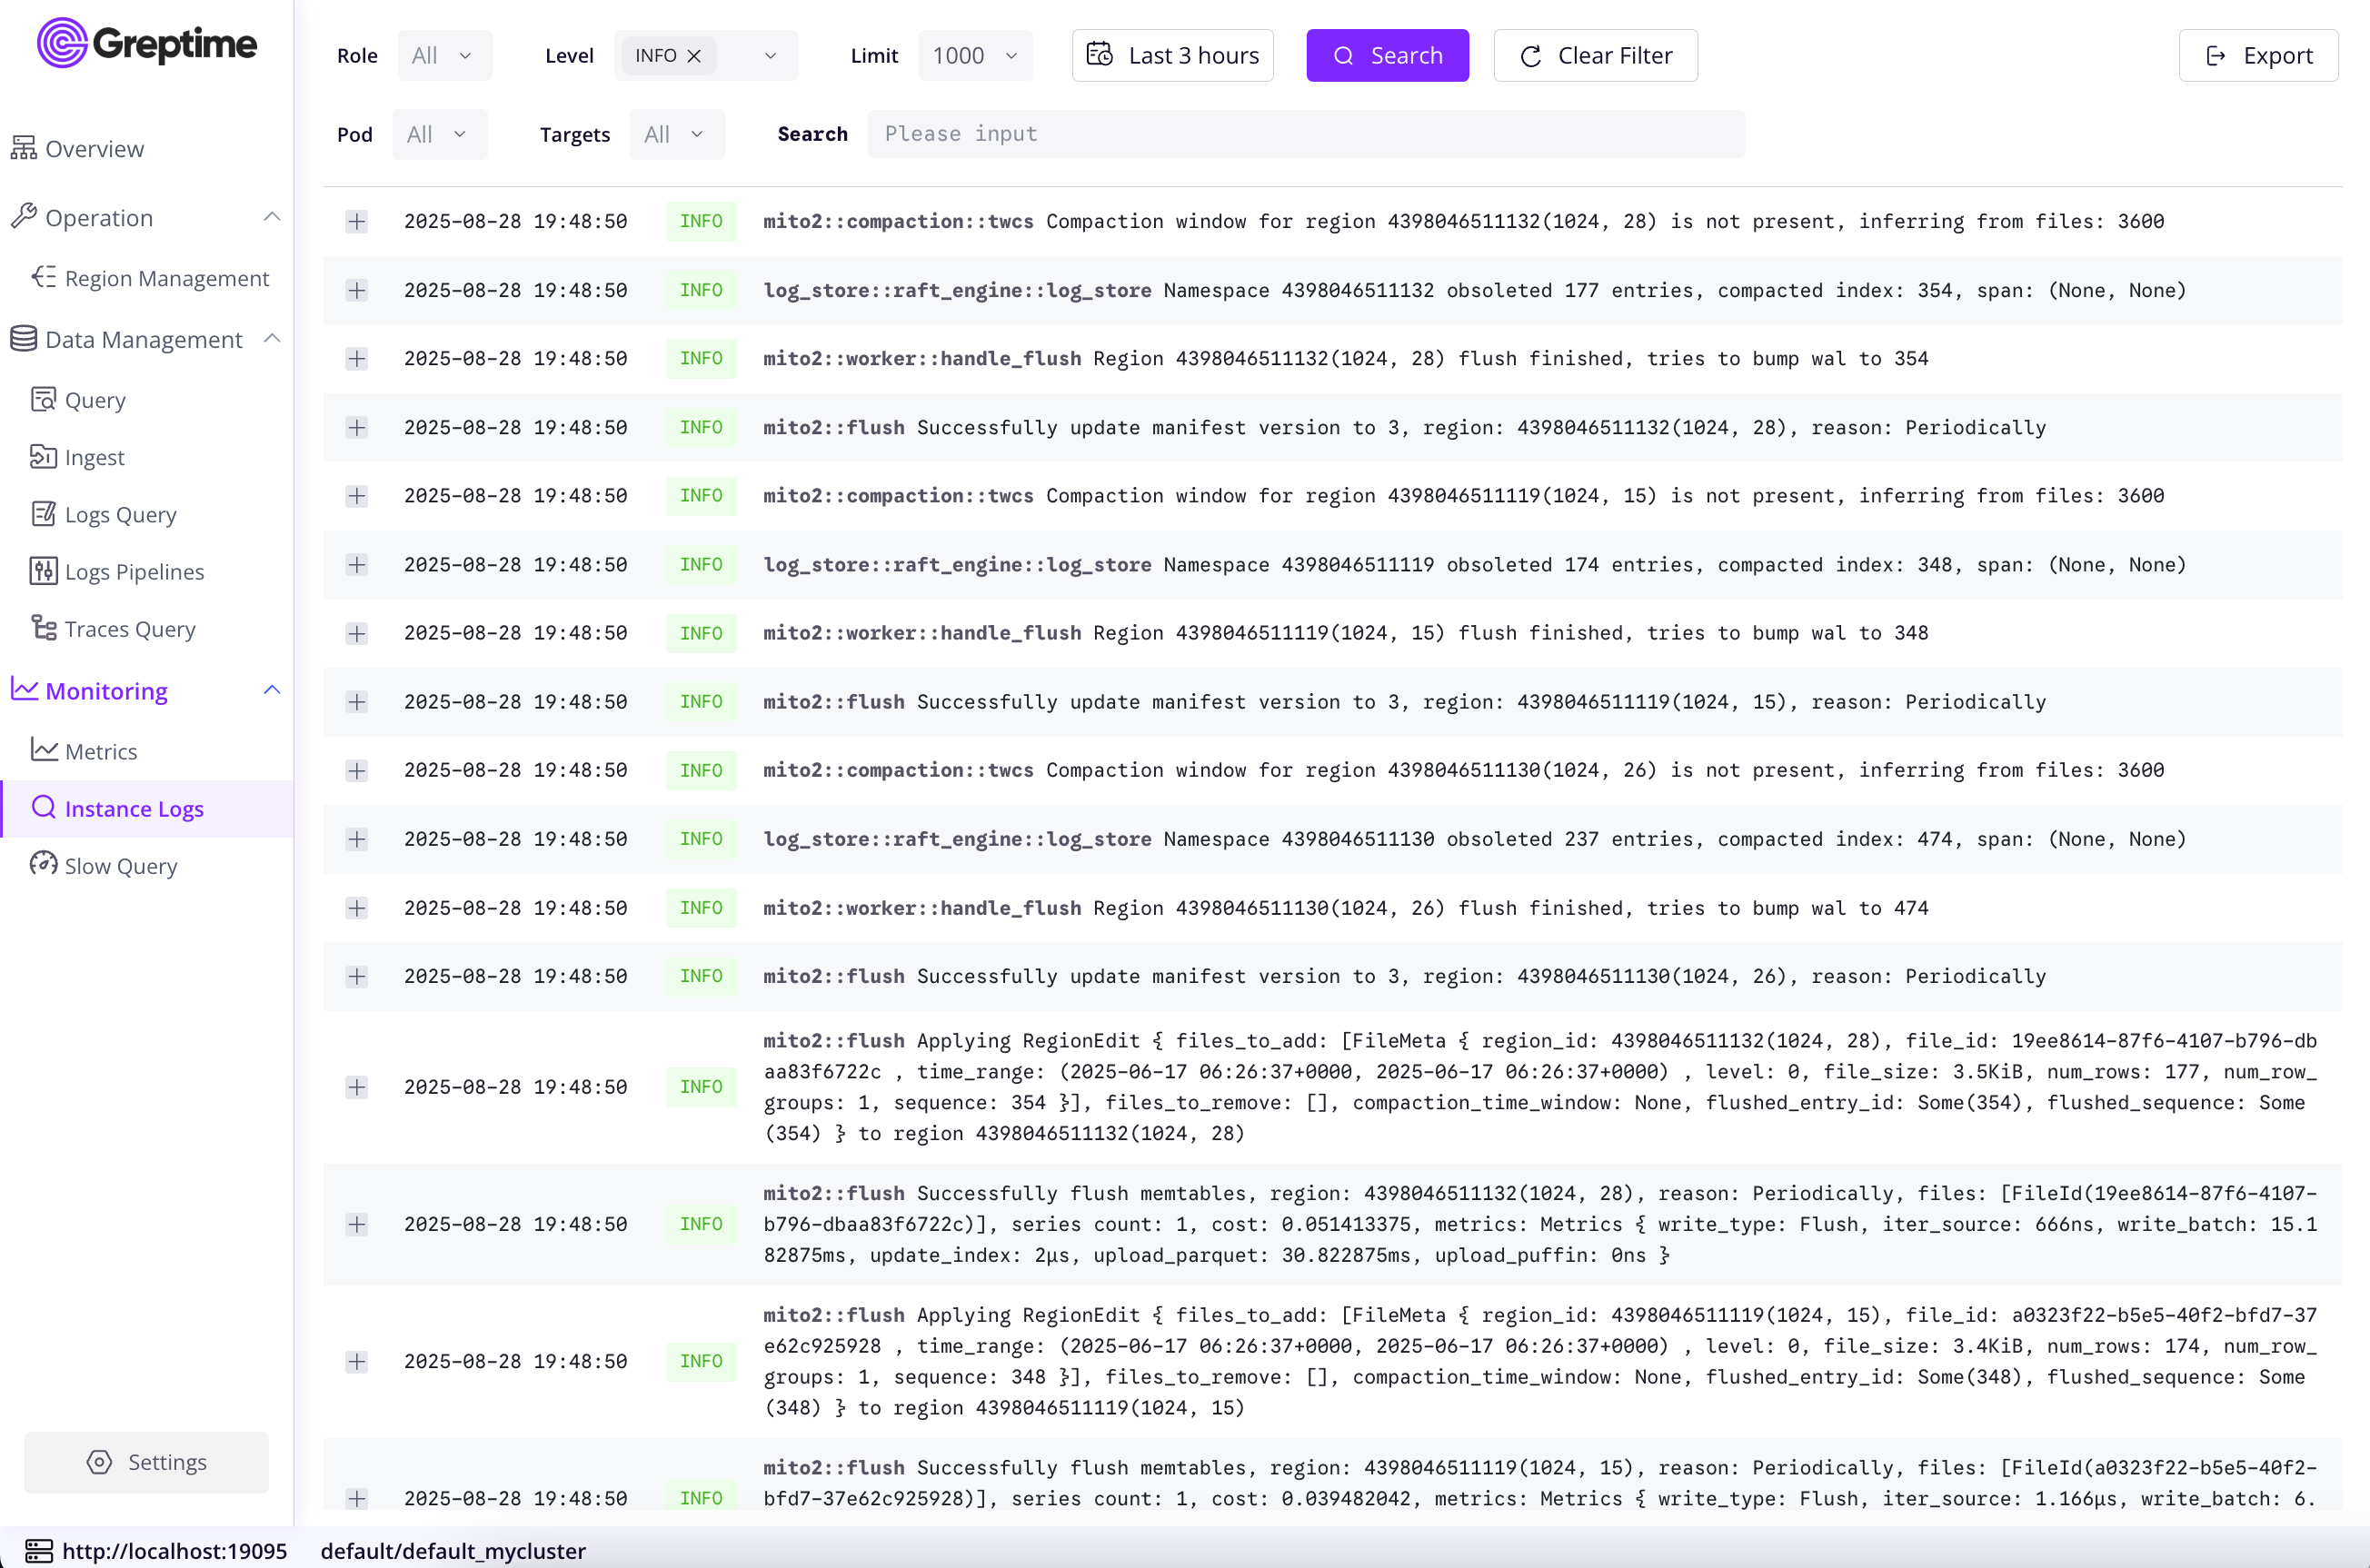
Instance Logs
Enables advanced log filtering and analysis with support for filtering by role, instance, log level, time range, and keywords. Log results can be exported to JSON format for further analysis.
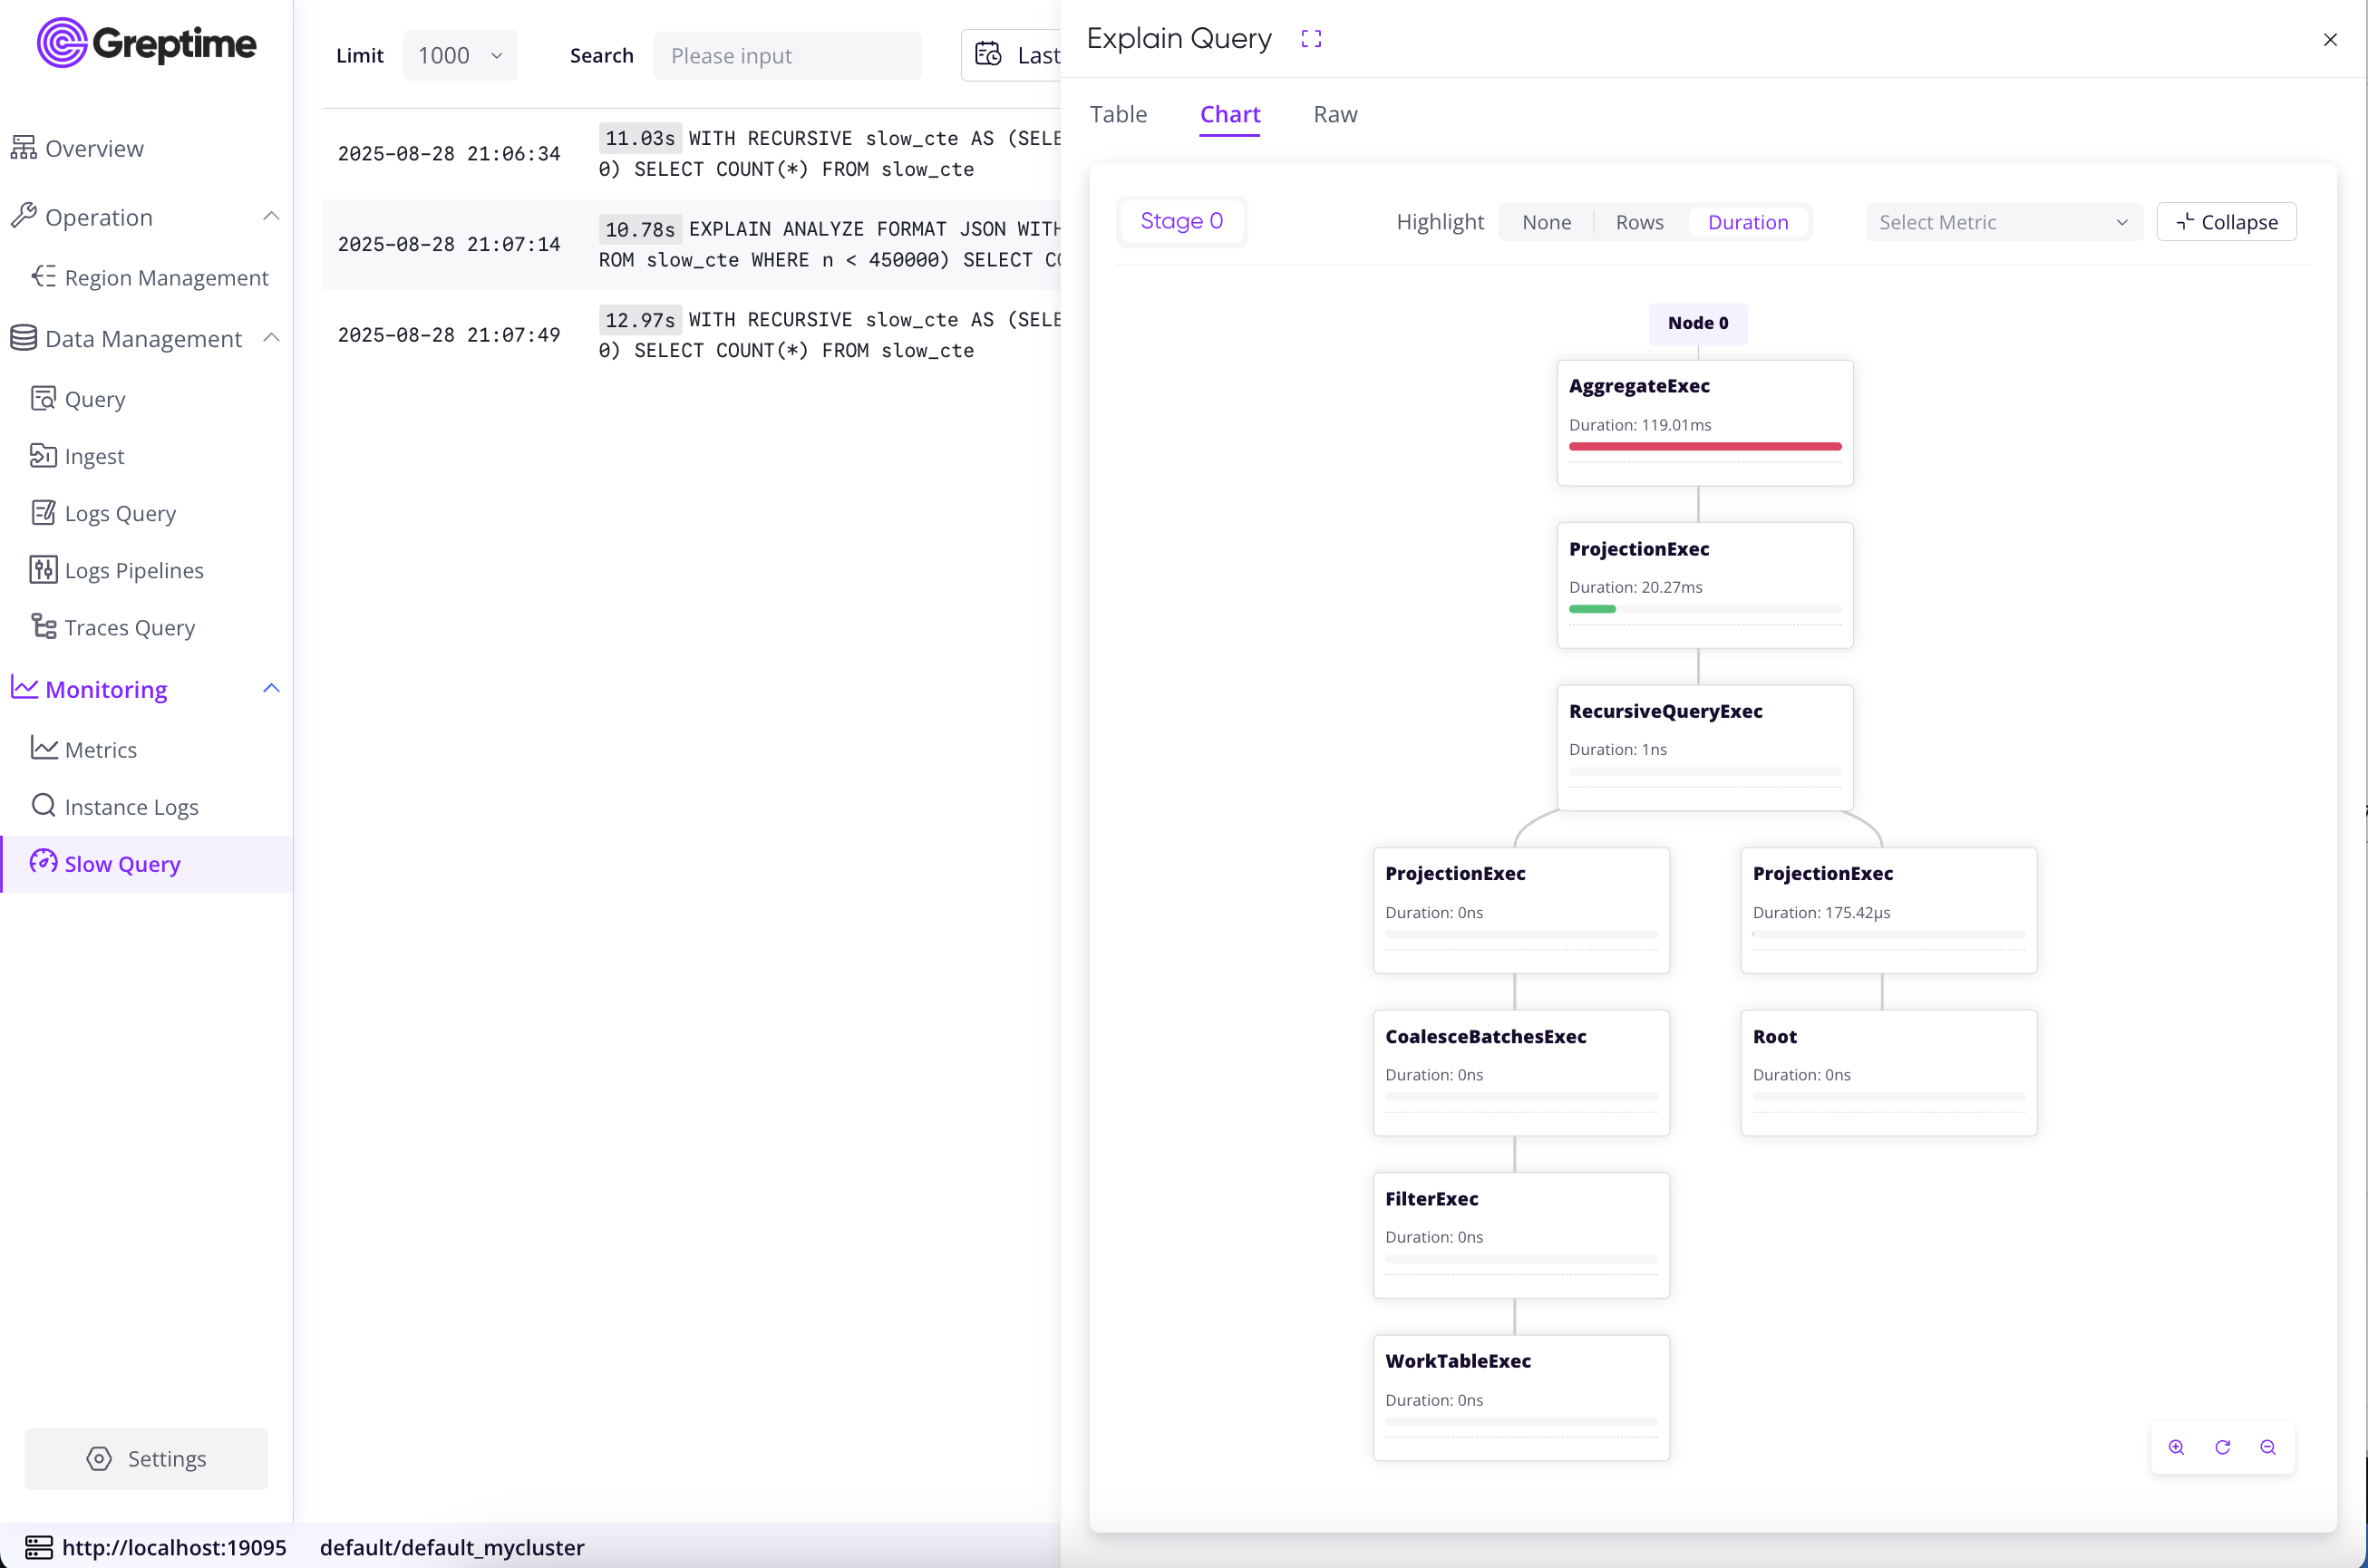
Slow Query
Displays long-running SQL and PromQL queries with detailed execution time and query text information. Includes Explain Query functionality for execution plan analysis and query optimization.