Deploying Kafka Cluster
In this guide, you will learn how to deploy a Kafka cluster on Kubernetes using a Helm Chart.
Prerequisites
Configuration Management
Before installation, you need to create a configuration file for the Kafka cluster. Please adjust the following kafka-values.yaml reference configuration according to your Kubernetes environment:
image:
  registry: docker.io
  repository: greptime/kafka
  tag: 3.9.0-debian-12-r1

listeners:
  client:
    containerPort: 9092
    protocol: PLAINTEXT
    name: CLIENT
  controller:
    protocol: PLAINTEXT

heapOpts: "-Xmx512m -Xms512m -XX:MetaspaceSize=96m -XX:+UseG1GC -XX:MaxGCPauseMillis=20 -XX:InitiatingHeapOccupancyPercent=35 -XX:G1HeapRegionSize=16M -XX:MinMetaspaceFreeRatio=50 -XX:MaxMetaspaceFreeRatio=80 -XX:+ExplicitGCInvokesConcurrent"

controller:
  replicaCount: 3
  resources:
    limits:
      cpu: '1'
      memory: 1Gi
    requests:
      cpu: 500m
      memory: 512Mi
  persistence:
    enabled: true
    storageClass: ""
    size: 50Gi

broker:
  replicaCount: 3
  resources:
    limits:
      cpu: '1'
      memory: 1Gi
    requests:
      cpu: 500m
      memory: 512Mi
  persistence:
    enabled: true
    storageClass: ""
    size: 50Gi

extraConfig: |
  num.network.threads=3
  num.io.threads=8
  min.insync.replicas=1
  socket.send.buffer.bytes=102400
  socket.receive.buffer.bytes=102400
  socket.request.max.bytes=104857600
  num.recovery.threads.per.data.dir=1
  offsets.topic.replication.factor=1
  transaction.state.log.replication.factor=1
  transaction.state.log.min.isr=1
  allow.everyone.if.no.acl.found=true
  auto.create.topics.enable=true
  default.replication.factor=1
  max.partition.fetch.bytes=1048576
  max.request.size=1048576
  message.max.bytes=20000000
  log.dirs=/bitnami/kafka/data
  log.flush.interval.messages=10000
  log.flush.interval.ms=1000
  log.retention.hours=4
  log.roll.hours=3
  log.retention.bytes=250000000
  log.segment.bytes=1073741824
Installing Kafka Cluster
Install the Kafka cluster in the kafka namespace:
helm upgrade --install kafka \
  --create-namespace \
  oci://registry-1.docker.io/bitnamicharts/kafka \
  --version 31.0.0 \
  -n kafka --values kafka-values.yaml
Expected Output
Release "kafka" does not exist. Installing it now.
Pulled: greptime-registry.cn-hangzhou.cr.aliyuncs.com/charts/kafka:31.0.0
Digest: sha256:85b135981fd5d951ceef8b51cdcbc6917ebface50d0eb3367eb7ddc4a5db482b
NAME: kafka
LAST DEPLOYED: Tue May 12 00:57:32 2026
NAMESPACE: kafka
STATUS: deployed
REVISION: 1
TEST SUITE: None
NOTES:
CHART NAME: kafka
CHART VERSION: 31.0.0
APP VERSION: 3.9.0

** Please be patient while the chart is being deployed **

Kafka can be accessed by consumers via port 9092 on the following DNS name from within your cluster:

    kafka.kafka.svc.cluster.local

Each Kafka broker can be accessed by producers via port 9092 on the following DNS name(s) from within your cluster:

    kafka-controller-0.kafka-controller-headless.kafka.svc.cluster.local:9092
    kafka-broker-0.kafka-broker-headless.kafka.svc.cluster.local:9092

To create a pod that you can use as a Kafka client run the following commands:

    kubectl run kafka-client --restart='Never' --image greptime-registry.cn-hangzhou.cr.aliyuncs.com/greptime/kafka:3.9.0-debian-12-r1 --namespace kafka --command -- sleep infinity
    kubectl exec --tty -i kafka-client --namespace kafka -- bash

    PRODUCER:
        kafka-console-producer.sh \
            --bootstrap-server kafka.kafka.svc.cluster.local:9092 \
            --topic test

    CONSUMER:
        kafka-console-consumer.sh \
            --bootstrap-server kafka.kafka.svc.cluster.local:9092 \
            --topic test \
            --from-beginning

Substituted images detected:
- greptime-registry.cn-hangzhou.cr.aliyuncs.com/greptime/kafka:3.9.0-debian-12-r1
Verifying Kafka Cluster Installation
Check the status of Kafka components (Broker and Controller):
kubectl get pod -n kafka
Expected Output
NAME                 READY   STATUS    RESTARTS   AGE
kafka-broker-0       1/1     Running   0          8m3s
kafka-broker-1       1/1     Running   0          8m2s
kafka-broker-2       1/1     Running   0          8m1s
kafka-controller-0   1/1     Running   0          8m3s
kafka-controller-1   1/1     Running   0          8m2s
kafka-controller-0   1/1     Running   0          8m1s
Configuring Kafka Endpoints
After the Kafka cluster is deployed, GreptimeDB can enable Remote WAL by configuring Kafka endpoints. For more information, refer to this documentation.
remoteWal:
  enabled: true
  kafka:
    brokerEndpoints:
      - "kafka-broker-0.kafka-broker-headless.kafka.svc.cluster.local:9092"
      - "kafka-broker-1.kafka-broker-headless.kafka.svc.cluster.local:9092"
      - "kafka-broker-2.kafka-broker-headless.kafka.svc.cluster.local:9092"
Monitoring
- Install Prometheus Operator (eg: kube-prometheus-stack)。
- Install the servicemonitor CRD。
To monitor the Kafka cluster, you need to have a monitoring system (such as Prometheus and Grafana) deployed in advance. Then add the following content to kafka-values.yaml and re-run the command to update the Kafka configuration:
metrics:
  jmx:
    enabled: true
    image:
      registry: greptime-registry.cn-hangzhou.cr.aliyuncs.com
      repository: greptime/jmx-exporter
      tag: 1.0.1-debian-12-r9
  serviceMonitor:
    enabled: true
    namespace: "kafka"
    interval: "10s"
    labels:
      release: kube-prometheus-stack
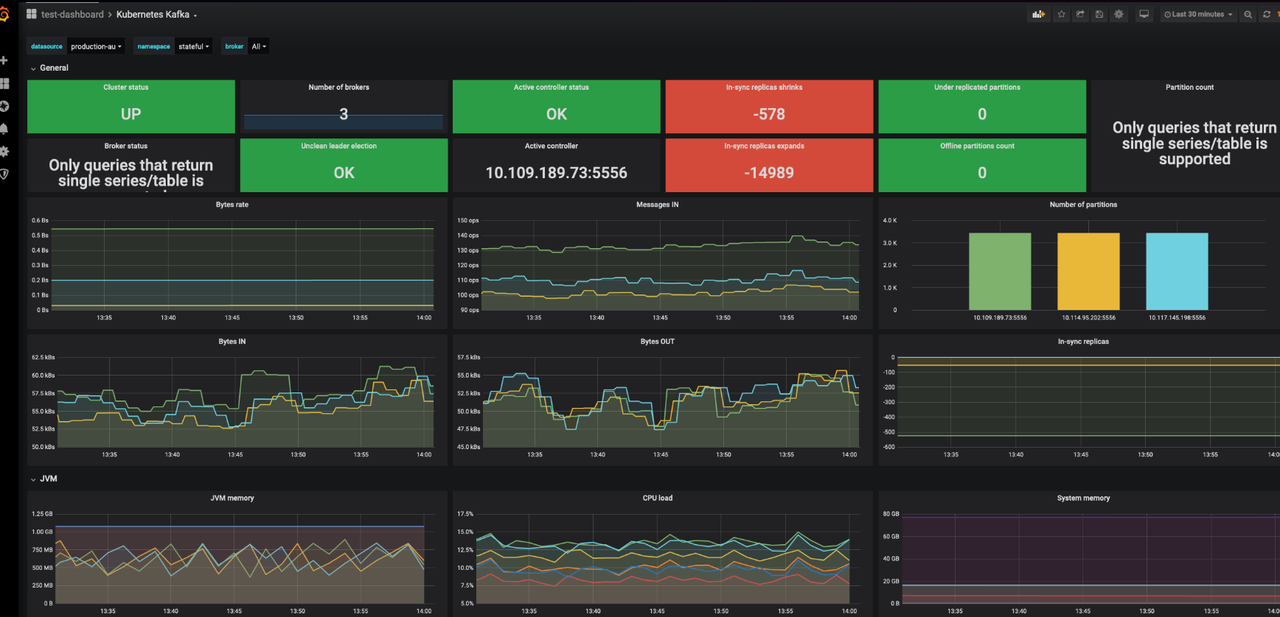
Grafana dashboard
Use Kubernetes Kafka (ID: 12483) to monitor Kafka metrics.
- Log in to your Grafana.
- Navigate to Dashboards -> New -> Import.
- Enter Dashboard ID: 12483, select a data source and load the dashboard.
Uninstalling Kafka Cluster
Use the following command to uninstall the Kafka cluster:
helm -n kafka uninstall kafka
Deleting PVCs
Deleting PVCs will remove persistent data from the Kafka cluster. Please ensure you have backed up your data before proceeding.
kubectl -n kafka delete pvc -l app.kubernetes.io/instance=kafka