Collect Kubernetes Events with OpenTelemetry Collector and GreptimeDB
This guide shows how to collect Kubernetes events with the OpenTelemetry Collector, convert them into a structured table with a GreptimeDB pipeline, and query them with SQL.
Kubernetes Events
Kubernetes events record state changes and errors of cluster objects,
such as pod scheduling, image pulls, container restarts, failed probes, and scaling actions.
kubectl get events and kubectl describe show them.
By default, the kube-apiserver keeps events for one hour, as set by the --event-ttl flag.
In GreptimeDB, events are kept until the table's TTL expires, and you can query them with SQL.
Architecture Overview
Components:
- OpenTelemetry Collector: Watches the
events.k8s.io/v1API with thek8s_objectsreceiver and sends each event to GreptimeDB as an OTLP log record. - GreptimeDB pipeline: Parses the event object in the log body and extracts the fields used for querying.
- GreptimeDB: Stores events in a table with indexes for filtering and full-text search.
Vector does not have a source for Kubernetes events.
Its kubernetes_logs source collects container logs only.
Prerequisites
- A running Kubernetes cluster
kubectlconfigured to access your cluster- Helm v3.0.0 or higher installed
- A GreptimeDB cluster running in the Kubernetes cluster. See Deploy GreptimeDB Cluster.
This guide assumes the GreptimeDB cluster is named greptimedb and runs in the greptime-cluster namespace,
the same as in Monitor Kubernetes Metrics with Prometheus and GreptimeDB.
The frontend service address inside the Kubernetes cluster is:
greptimedb-frontend.greptime-cluster.svc.cluster.local:4000
If you use a different name or namespace, replace this address in every configuration in this guide.
The examples on this page are tested with Kubernetes v1.30.0 and the OpenTelemetry Collector Helm chart 0.178.3 (Collector v0.163.2).
Create the Pipeline
The k8s_objects receiver puts the whole watch notification in the log body:
the watch type (ADDED or MODIFIED) and the complete Event object, including managedFields.
Without a pipeline, GreptimeDB stores the notification as a single JSON string in the body column.
The k8s_events_pipeline pipeline extracts the fields used for querying into separate columns.
Port-forward the HTTP port (4000) and the MySQL port (4002) of the GreptimeDB frontend to your local machine:
kubectl port-forward -n greptime-cluster svc/greptimedb-frontend 4000:4000 4002:4002
Create a file named k8s_events_pipeline.yaml:
version: 2
processors:
  - vrl:
      source: |
        event = parse_json!(.Body)
        obj = object!(event.object)
        count = obj.series.count
        if is_null(count) { count = obj.deprecatedCount }
        if is_null(count) { count = 1 }
        . = {
          "timestamp": .ObservedTimestamp,
          "k8s_namespace": obj.metadata.namespace,
          "object_kind": obj.regarding.kind,
          "object_name": obj.regarding.name,
          "event_type": obj.type,
          "reason": obj.reason,
          "note": obj.note,
          "reporting_controller": obj.reportingController,
          "reporting_instance": obj.reportingInstance,
          "count": count,
          "event_uid": obj.metadata.uid
        }
        .

transform:
  - field: timestamp
    type: epoch, ns
    index: timestamp
  - fields:
      - k8s_namespace
      - object_kind
      - event_type
    type: string
    tag: true
  - field: object_name
    type: string
    index: skipping
  - field: reason
    type: string
    index: inverted
  - field: note
    type: string
    index: fulltext
  - fields:
      - reporting_controller
      - reporting_instance
      - event_uid
    type: string
  - field: count
    type: int64
The pipeline works as follows:
BodyandObservedTimestampare fields of the pipeline input for OTLP logs.Bodyholds the watch notification as a JSON string.- The
vrlprocessor parses the body and replaces the pipeline context with the selected fields, somanagedFieldsand other unused fields are not stored. timestampis the time the collector received the notification. When an event repeats, Kubernetes updates the existing Event object, and the update arrives as aMODIFIEDnotification. Event recorders batch, aggregate, or rate-limit these updates, so one notification can cover several occurrences, and some occurrences produce no notification.countis the occurrence count stored in the Event object when the notification was sent. Events written through theevents.k8s.io/v1API store it inseries.count, and events written through the corev1API (for example, by kubelet) store it indeprecatedCount. If neither field is set,countis1. Because of the batching described fortimestamp, the value can lag behind the actual number of occurrences.k8s_namespace,object_kind, andevent_typeare tags. Their cardinality is low.object_namehas a skipping index,reasonhas an inverted index, andnotehas a full-text index.
Upload the pipeline:
curl -X POST "http://localhost:4000/v1/pipelines/k8s_events_pipeline" \
  -F "file=@k8s_events_pipeline.yaml"
{"pipelines":[{"name":"k8s_events_pipeline","version":"2026-11-17 12:37:57.195976821"}],"execution_time_ms":1}
For more information about pipelines, see Manage Pipelines.
Install the OpenTelemetry Collector
Add the OpenTelemetry Helm Repository
helm repo add open-telemetry https://open-telemetry.github.io/opentelemetry-helm-charts
helm repo update
Configure the Collector
Create an otel-collector-values.yaml file:
mode: deployment
# Each replica watches all events. More than one replica writes duplicate rows.
replicaCount: 1

image:
  repository: otel/opentelemetry-collector-contrib

clusterRole:
  create: true
  rules:
    - apiGroups: ["events.k8s.io"]
      resources: ["events"]
      verbs: ["list", "watch"]

config:
  receivers:
    k8s_objects:
      objects:
        - name: events
          group: events.k8s.io
          mode: watch
          exclude_watch_type: [DELETED]
  exporters:
    otlp_http/greptimedb:
      endpoint: http://greptimedb-frontend.greptime-cluster.svc.cluster.local:4000/v1/otlp
      headers:
        x-greptime-log-table-name: k8s_events
        x-greptime-pipeline-name: k8s_events_pipeline
  service:
    pipelines:
      logs:
        receivers: [k8s_objects]
        exporters: [otlp_http/greptimedb]
      metrics: null
      traces: null
The configuration does the following:
mode: deploymentwithreplicaCount: 1runs a single collector for the whole cluster.clusterRolegrants the collector permission to list and watch events in all namespaces.- The
k8s_objectsreceiver watchesevents.k8s.io/v1events.exclude_watch_type: [DELETED]drops the notifications sent when the kube-apiserver deletes expired events. - The
otlp_http/greptimedbexporter sends logs to the GreptimeDB OTLP endpoint. Thex-greptime-log-table-nameheader sets the table name, and thex-greptime-pipeline-nameheader selectsk8s_events_pipeline. metrics: nullandtraces: nullremove the metrics and traces pipelines from the chart's default configuration.
The collector does not replay existing events when it starts. Events created before the collector is installed, or while it is not running, are not collected.
If authentication is enabled in GreptimeDB,
add the basicauth extension to the exporter as shown in OTel Collector.
Install the Collector
helm install otel-collector open-telemetry/opentelemetry-collector \
  --namespace monitoring \
  --create-namespace \
  --values otel-collector-values.yaml
Check that the collector is running:
kubectl get pods -n monitoring -l app.kubernetes.io/name=opentelemetry-collector
NAME                                                      READY   STATUS    RESTARTS   AGE
otel-collector-opentelemetry-collector-56d8864b4b-gm9gl   1/1     Running   0          2s
Verify the Events in GreptimeDB
Create a deployment that references an image that does not exist.
Kubernetes emits Warning events when it fails to pull the image:
kubectl create deployment bad-image --image=nginx:does-not-exist
Connect to GreptimeDB with a MySQL client through the port-forward from Create the Pipeline:
mysql -h 127.0.0.1 -P 4002
GreptimeDB creates the k8s_events table when the first event arrives:
SHOW CREATE TABLE k8s_events;
CREATE TABLE IF NOT EXISTS `k8s_events` (
  `timestamp` TIMESTAMP(9) NOT NULL,
  `k8s_namespace` STRING NULL,
  `object_kind` STRING NULL,
  `event_type` STRING NULL,
  `object_name` STRING NULL SKIPPING INDEX WITH(false_positive_rate = '0.01', granularity = '10240', type = 'BLOOM'),
  `reason` STRING NULL INVERTED INDEX,
  `note` STRING NULL FULLTEXT INDEX WITH(analyzer = 'English', backend = 'bloom', case_sensitive = 'false', false_positive_rate = '0.01', granularity = '10240'),
  `reporting_controller` STRING NULL,
  `reporting_instance` STRING NULL,
  `event_uid` STRING NULL,
  `count` BIGINT NULL,
  TIME INDEX (`timestamp`),
  PRIMARY KEY (`k8s_namespace`, `object_kind`, `event_type`)
)

ENGINE=mito
WITH(
  'comment' = 'Created on insertion',
  append_mode = 'true',
  'greptime.semantic.signal_type' = 'log',
  'greptime.semantic.source' = 'opentelemetry'
)
The table is created in append mode, so every notification is kept as a separate row.
Query Events
List the latest warnings:
SELECT timestamp, k8s_namespace, object_kind, object_name, reason, note
FROM k8s_events
WHERE event_type = 'Warning'
ORDER BY timestamp DESC
LIMIT 5;
+----------------------------+---------------+-------------+---------------------------+--------+-------------------------------------------------------------+
| timestamp                  | k8s_namespace | object_kind | object_name               | reason | note                                                        |
+----------------------------+---------------+-------------+---------------------------+--------+-------------------------------------------------------------+
| 2026-11-17 12:38:56.564240 | default       | Pod         | bad-image-66c6f97bd-mtm6v | Failed | Error: ImagePullBackOff                                     |
| 2026-11-17 12:38:42.134856 | default       | Pod         | bad-image-66c6f97bd-mtm6v | Failed | Error: ErrImagePull                                         |
| 2026-11-17 12:38:42.132237 | default       | Pod         | bad-image-66c6f97bd-mtm6v | Failed | Failed to pull image "nginx:does-not-exist": rpc error: ... |
| 2026-11-17 12:38:28.576529 | default       | Pod         | bad-image-66c6f97bd-mtm6v | Failed | Error: ImagePullBackOff                                     |
| 2026-11-17 12:38:16.063063 | default       | Pod         | bad-image-66c6f97bd-mtm6v | Failed | Error: ErrImagePull                                         |
+----------------------------+---------------+-------------+---------------------------+--------+-------------------------------------------------------------+
Count Warning notifications by reason in the last hour.
Each row is one received notification, not one occurrence of the event:
SELECT reason, object_kind, count(*) AS notifications
FROM k8s_events
WHERE event_type = 'Warning'
  AND timestamp > now() - INTERVAL '1' HOUR
GROUP BY reason, object_kind
ORDER BY notifications DESC;
+--------+-------------+---------------+
| reason | object_kind | notifications |
+--------+-------------+---------------+
| Failed | Pod         |             9 |
+--------+-------------+---------------+
Count warnings per minute in each namespace:
SELECT date_bin(INTERVAL '1' MINUTE, timestamp) AS minute, k8s_namespace, count(*) AS notifications
FROM k8s_events
WHERE event_type = 'Warning'
GROUP BY minute, k8s_namespace
ORDER BY minute;
+---------------------+---------------+---------------+
| minute              | k8s_namespace | notifications |
+---------------------+---------------+---------------+
| 2026-11-17 12:38:00 | default       |             9 |
+---------------------+---------------+---------------+
Search event messages with full-text search:
SELECT timestamp, object_name, note
FROM k8s_events
WHERE note @@ 'Back-off'
ORDER BY timestamp DESC
LIMIT 3;
+----------------------------+---------------------------+-----------------------------------------------+
| timestamp                  | object_name               | note                                          |
+----------------------------+---------------------------+-----------------------------------------------+
| 2026-11-17 12:38:56.561306 | bad-image-66c6f97bd-mtm6v | Back-off pulling image "nginx:does-not-exist" |
| 2026-11-17 12:38:28.569168 | bad-image-66c6f97bd-mtm6v | Back-off pulling image "nginx:does-not-exist" |
| 2026-11-17 12:38:01.133685 | bad-image-66c6f97bd-mtm6v | Back-off pulling image "nginx:does-not-exist" |
+----------------------------+---------------------------+-----------------------------------------------+
Show the event history of a pod. Replace the pod name with one from your cluster:
SELECT timestamp, reason, count, note
FROM k8s_events
WHERE object_name = 'bad-image-66c6f97bd-mtm6v'
ORDER BY timestamp;
+----------------------------+-----------+-------+----------------------------------------------------------------------------------+
| timestamp                  | reason    | count | note                                                                             |
+----------------------------+-----------+-------+----------------------------------------------------------------------------------+
| 2026-11-17 12:37:59.239772 | Scheduled |     1 | Successfully assigned default/bad-image-66c6f97bd-mtm6v to k8s-tut-control-plane |
| 2026-11-17 12:37:59.618471 | Pulling   |     1 | Pulling image "nginx:does-not-exist"                                             |
| 2026-11-17 12:38:00.177770 | Failed    |     1 | Failed to pull image "nginx:does-not-exist": rpc error: ...                      |
| 2026-11-17 12:38:00.179947 | Failed    |     1 | Error: ErrImagePull                                                              |
| 2026-11-17 12:38:01.133685 | BackOff   |     1 | Back-off pulling image "nginx:does-not-exist"                                    |
| 2026-11-17 12:38:01.136782 | Failed    |     1 | Error: ImagePullBackOff                                                          |
| 2026-11-17 12:38:15.561016 | Pulling   |     2 | Pulling image "nginx:does-not-exist"                                             |
| 2026-11-17 12:38:16.059460 | Failed    |     2 | Failed to pull image "nginx:does-not-exist": rpc error: ...                      |
| 2026-11-17 12:38:16.063063 | Failed    |     2 | Error: ErrImagePull                                                              |
| 2026-11-17 12:38:28.569168 | BackOff   |     2 | Back-off pulling image "nginx:does-not-exist"                                    |
| ......                                                                                                                         |
+----------------------------+-----------+-------+----------------------------------------------------------------------------------+
View Events in the GreptimeDB Dashboard
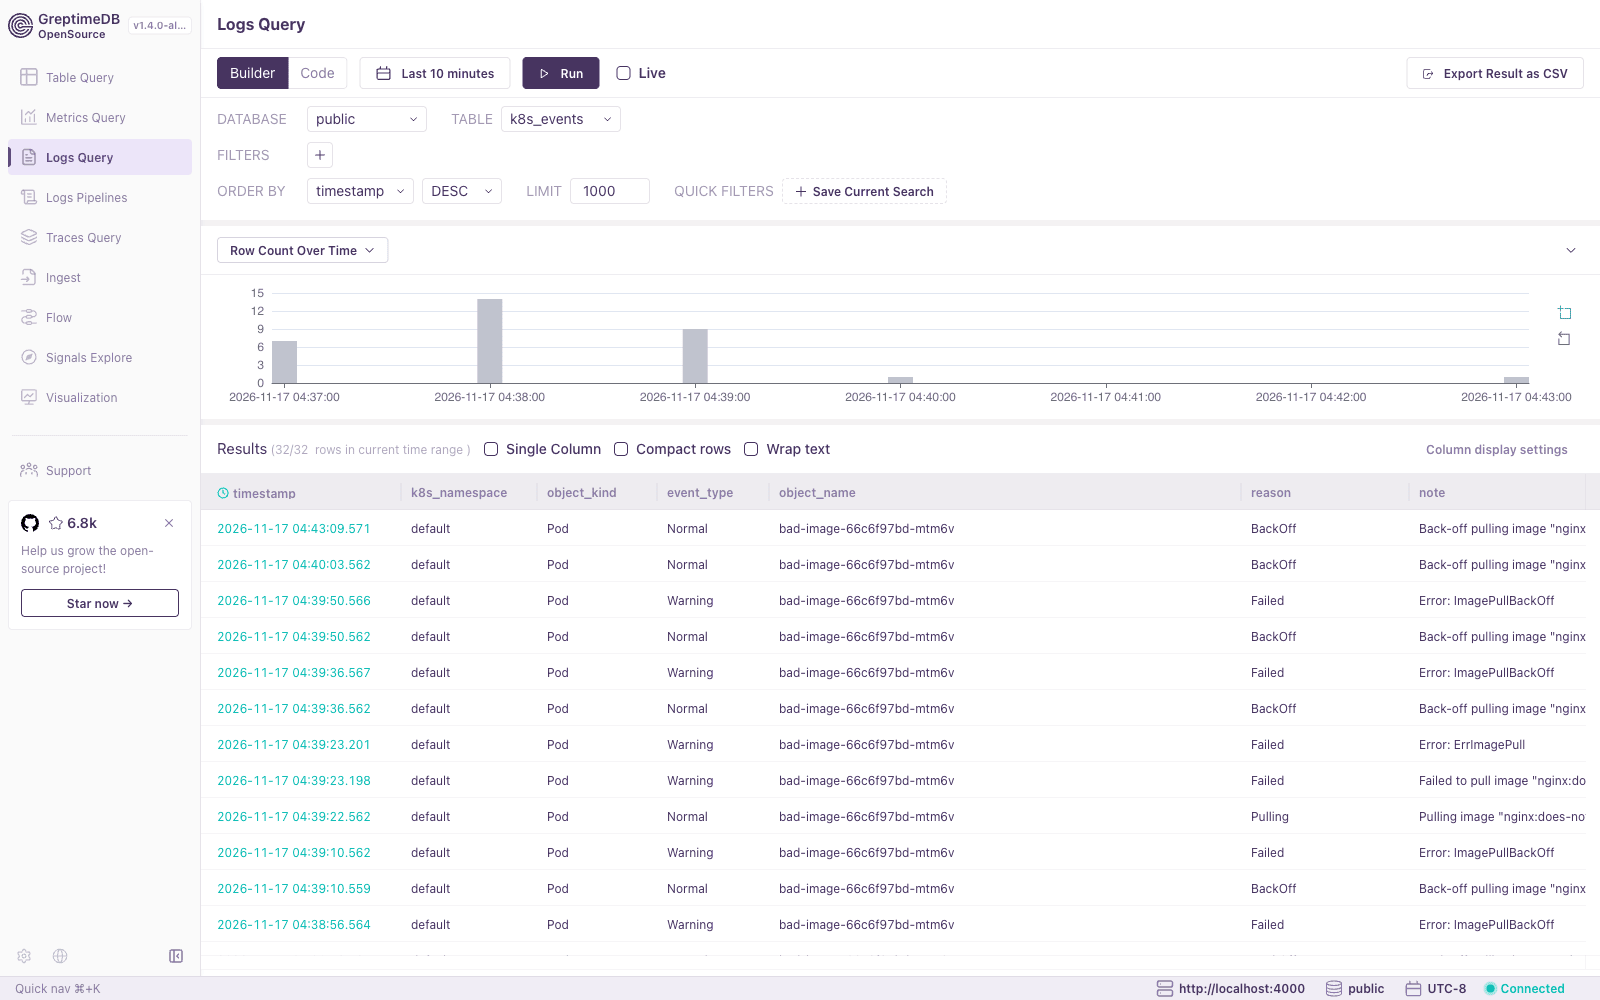
GreptimeDB includes a web dashboard with a Logs Query view.
With the port-forward from Create the Pipeline running, open http://localhost:4000/dashboard,
select Logs Query in the sidebar, and select the k8s_events table.
The view shows the number of rows over time and the event rows in the selected time range.
View Events in Grafana
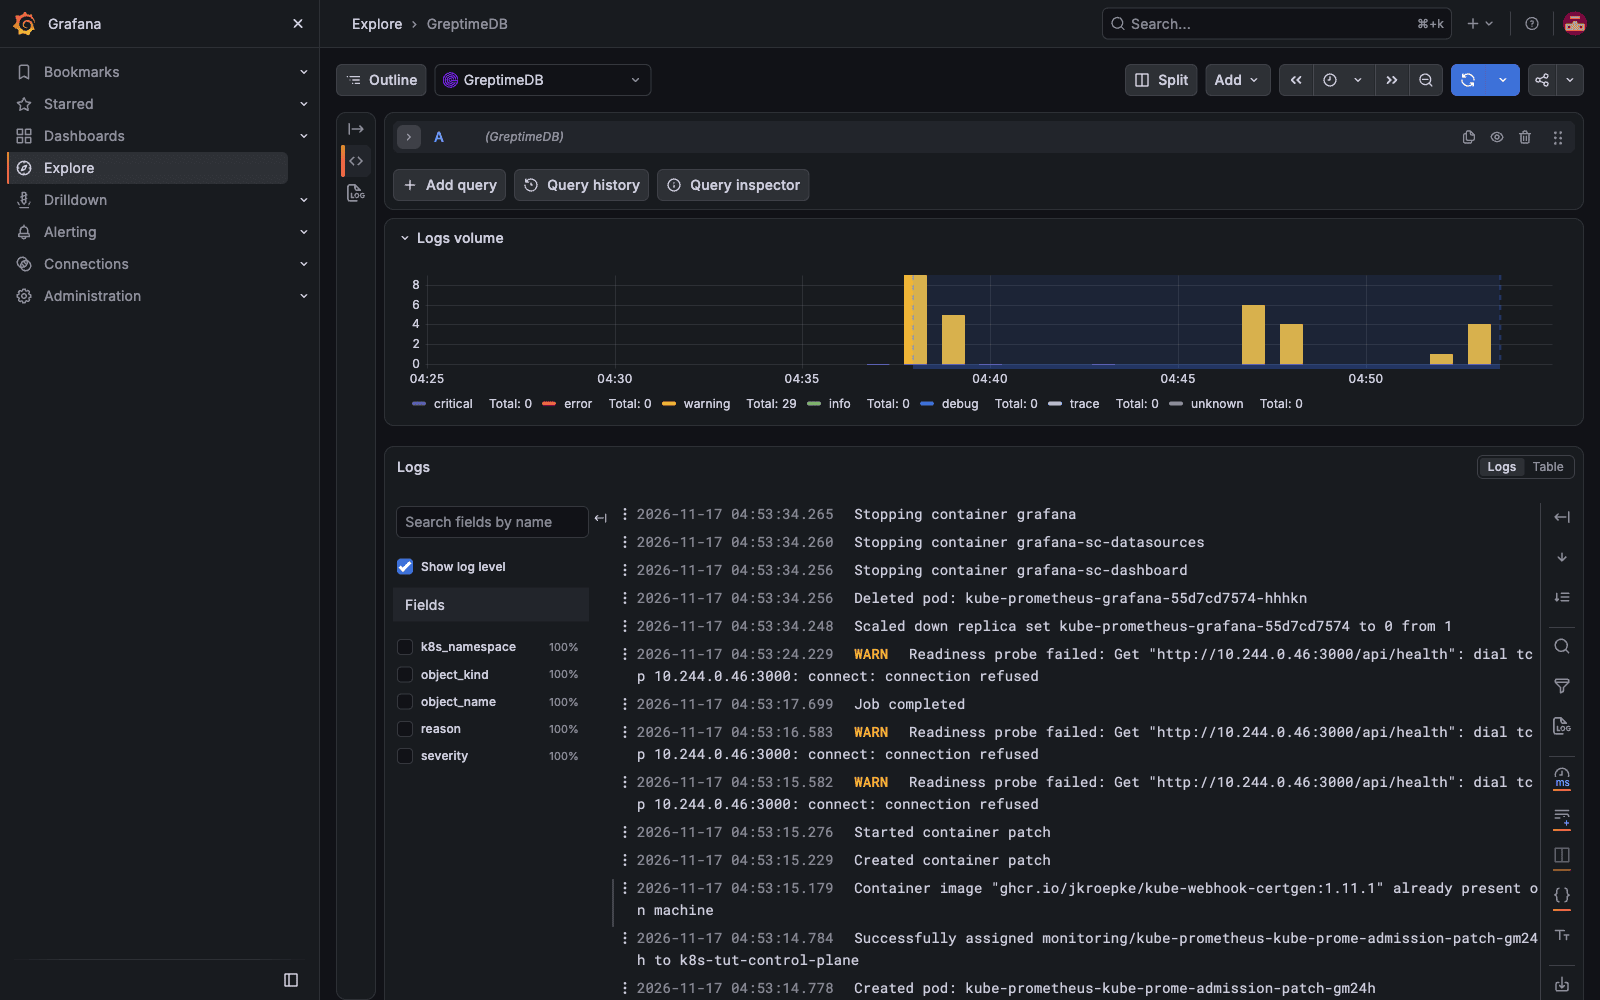
The GreptimeDB data source plugin for Grafana provides a Logs query type, which displays query results in Grafana's log view.
This section uses the Grafana installed by kube-prometheus-stack in
Monitor Kubernetes Metrics with Prometheus and GreptimeDB.
Update kube-prometheus-values.yaml to install the plugin and add a GreptimeDB data source:
prometheus:
  prometheusSpec:
    remoteWrite:
      - url: http://greptimedb-frontend.greptime-cluster.svc.cluster.local:4000/v1/prometheus/write

grafana:
  sidecar:
    datasources:
      url: http://greptimedb-frontend.greptime-cluster.svc.cluster.local:4000/v1/prometheus
  # Install the GreptimeDB data source plugin, in the format <plugin ID>@<version>@<URL>
  plugins:
    - info8fcc-greptimedb-[email protected]@https://github.com/GreptimeTeam/greptimedb-grafana-datasource/releases/download/v3.0.4/info8fcc-greptimedb-datasource-unsigned.zip
  grafana.ini:
    plugins:
      allow_loading_unsigned_plugins: info8fcc-greptimedb-datasource
  additionalDataSources:
    - name: GreptimeDB
      type: info8fcc-greptimedb-datasource
      url: http://greptimedb-frontend.greptime-cluster.svc.cluster.local:4000
      jsonData:
        host: http://greptimedb-frontend.greptime-cluster.svc.cluster.local:4000
        database: public
        logs:
          defaultDatabase: public
          defaultTable: k8s_events
          timeColumn: timestamp
          messageColumn: note
          levelColumn: event_type
          selectContextColumns: true
          contextColumns:
            - k8s_namespace
            - object_kind
            - object_name
            - reason
The logs settings map the columns of the k8s_events table to the log view:
note is the log message, and event_type is the log level, so Warning events are shown as warnings.
The columns in contextColumns are added to each log query and shown as fields of each log line.
This configuration was tested with kube-prometheus-stack 93.3.1, which installs Grafana 13.3.1.
Upgrade the release:
helm upgrade kube-prometheus prometheus-community/kube-prometheus-stack \
  --namespace monitoring \
  --values kube-prometheus-values.yaml
Then log in to Grafana and query the events:
- Open Explore and select the GreptimeDB data source.
- Set Query Type to Logs. The builder fills in the
k8s_eventstable and the time, message, and level columns from the data source settings. - In Columns, remove
trace_id. The plugin adds atrace_idcolumn to logs queries by default, and thek8s_eventstable does not have this column. - Click Run query.
Clean Up
Remove the test deployment:
kubectl delete deployment bad-image
Set Data Retention
The table keeps data forever by default. Set a TTL to delete old events automatically:
ALTER TABLE k8s_events SET 'ttl' = '30d';
Next Steps
- Build Grafana dashboards with the GreptimeDB data source plugin.
- Collect the metrics of the same cluster with Monitor Kubernetes Metrics with Prometheus and GreptimeDB.
- Learn more about pipeline configuration and the OpenTelemetry Collector integration.