Monitor Kubernetes Metrics with Prometheus and GreptimeDB
This guide demonstrates how to set up a complete Kubernetes monitoring solution using Prometheus for metrics collection and GreptimeDB as the long-term storage backend.
What is Kubernetes Monitoring
Kubernetes monitoring is the practice of collecting, analyzing, and acting on metrics and logs from a Kubernetes cluster. It provides visibility into the health, performance, and resource utilization of your containerized applications and infrastructure.
Key aspects of Kubernetes monitoring include:
- Resource Metrics: CPU, memory, disk, and network usage for nodes, pods, and containers
- Cluster Health: Status of cluster components like kube-apiserver, etcd, and controller-manager
- Application Metrics: Custom metrics from your applications running in the cluster
- Events and Logs: Kubernetes events and container logs for troubleshooting
Effective monitoring helps you:
- Detect and diagnose issues before they impact users
- Optimize resource utilization and reduce costs
- Plan capacity based on historical trends
- Ensure SLA compliance
- Troubleshoot performance bottlenecks
Architecture Overview
The monitoring architecture consists of the following components:

Components:
- kube-state-metrics: Exports cluster-level metrics about Kubernetes objects (deployments, pods, services, etc.)
- Node Exporter: Exports hardware and OS-level metrics from each Kubernetes node
- Prometheus Operator: Automates Prometheus deployment and configuration using Kubernetes custom resources
- GreptimeDB: Acts as the long-term storage backend for Prometheus metrics with high compression and query performance
- Grafana: Provides dashboards and visualizations for metrics stored in GreptimeDB
Prerequisites
Before starting, ensure you have:
- A running Kubernetes cluster (version >= 1.18)
kubectlconfigured to access your cluster- Helm v3.0.0 or higher installed
- Sufficient cluster resources (at least 2 CPU cores and 4GB memory available)
Install GreptimeDB
GreptimeDB serves as the long-term storage backend for Prometheus metrics. For detailed installation steps, please refer to the Deploy GreptimeDB Cluster documentation.
Verify the GreptimeDB Installation
After deploying GreptimeDB, verify that the cluster is running.
In this guide we assume the GreptimeDB cluster is deployed in the greptime-cluster namespace and named greptimedb.
kubectl -n greptime-cluster get greptimedbclusters.greptime.io greptimedb
NAME         FRONTEND   DATANODE   META   FLOWNODE   PHASE     VERSION   AGE
greptimedb   1          2          1      1          Running   v0.17.2   33s
Check the pods:
kubectl get pods -n greptime-cluster
NAME                                  READY   STATUS    RESTARTS    AGE
greptimedb-datanode-0                 1/1     Running   0           71s
greptimedb-datanode-1                 1/1     Running   0           97s
greptimedb-flownode-0                 1/1     Running   0           64s
greptimedb-frontend-8bf9f558c-7wdmk   1/1     Running   0           90s
greptimedb-meta-fc4ddb78b-nv944       1/1     Running   0           87s
Access GreptimeDB
To interact with GreptimeDB directly, you can port-forward the frontend service to your local machine.
GreptimeDB supports multiple protocols, with MySQL protocol available on port 4002 by default.
kubectl port-forward -n greptime-cluster svc/greptimedb-frontend 4002:4002
Connect using any MySQL-compatible client:
mysql -h 127.0.0.1 -P 4002
Storage Partitioning
To improve query performance and reduce storage costs,
GreptimeDB automatically creates columns based on Prometheus metric labels and stores metrics in a physical table.
The default table name is greptime_physical_table.
Since we deployed a GreptimeDB cluster with multiple datanodes,
you can partition the table to distribute data across datanodes for better scalability and performance.
In this Kubernetes monitoring scenario, we can use the namespace label as the partition key.
For example, with namespaces like kube-public, kube-system, monitoring, default, greptime-cluster, and etcd-cluster,
you can create a partitioning scheme based on the first letter of the namespace:
CREATE TABLE greptime_physical_table (
  greptime_value DOUBLE NULL,
  namespace STRING PRIMARY KEY,
  greptime_timestamp TIMESTAMP TIME INDEX,
)
PARTITION ON COLUMNS (namespace) (
  namespace < 'f',
  namespace >= 'f' AND namespace < 'g',
  namespace >= 'g' AND namespace < 'k',
  namespace >= 'k'
)
ENGINE = metric
WITH (
  "physical_metric_table" = ""
);
For more information about Prometheus metrics storage and query performance optimization, refer to the Improve efficiency by using metric engine guide.
Prometheus URLs in GreptimeDB
GreptimeDB provides Prometheus-compatible APIs under the HTTP context /v1/prometheus/,
enabling seamless integration with existing Prometheus workflows.
To integrate Prometheus with GreptimeDB, you need the GreptimeDB service address. Since GreptimeDB runs inside the Kubernetes cluster, use the internal cluster address.
The GreptimeDB frontend service address follows this pattern:
<greptimedb-name>-frontend.<namespace>.svc.cluster.local:<port>
In this guide:
- GreptimeDB cluster name:
greptimedb - Namespace:
greptime-cluster - Frontend port:
4000
So the service address is:
greptimedb-frontend.greptime-cluster.svc.cluster.local:4000
The complete Remote Write URL for Prometheus is:
http://greptimedb-frontend.greptime-cluster.svc.cluster.local:4000/v1/prometheus/write
This URL consists of:
- Service endpoint:
greptimedb-frontend.greptime-cluster.svc.cluster.local:4000 - API path:
/v1/prometheus/write
Install Prometheus
Now that GreptimeDB is running, we'll install Prometheus to collect metrics and send them to GreptimeDB for long-term storage.
Add the Prometheus Community Helm Repository
helm repo add prometheus-community https://prometheus-community.github.io/helm-charts
helm repo update
Install the kube-prometheus-stack
The kube-prometheus-stack is a comprehensive monitoring solution that includes
Prometheus, Grafana, kube-state-metrics, and node-exporter components.
This stack automatically discovers and monitors all Kubernetes namespaces,
collecting metrics from cluster components, nodes, and workloads.
In this deployment, we'll configure Prometheus to use GreptimeDB as the remote write destination for long-term metric storage and configure Grafana's default Prometheus data source to use GreptimeDB.
Create a kube-prometheus-values.yaml file with the following configuration:
# Configure Prometheus remote write to GreptimeDB
prometheus:
  prometheusSpec:
    remoteWrite:
      - url: http://greptimedb-frontend.greptime-cluster.svc.cluster.local:4000/v1/prometheus/write

# Configure Grafana to use GreptimeDB as the default Prometheus data source
grafana:
  datasources:
    datasources.yaml:
      apiVersion: 1
      datasources:
        - name: Prometheus
          type: prometheus
          url: http://greptimedb-frontend.greptime-cluster.svc.cluster.local:4000/v1/prometheus
          access: proxy
          editable: true
This configuration file specifies the GreptimeDB service address for:
- Prometheus remote write: Sends collected metrics to GreptimeDB for long-term storage
- Grafana data source: Configures GreptimeDB as the default Prometheus data source for dashboard queries
Install the kube-prometheus-stack using Helm with the custom values file:
helm install kube-prometheus prometheus-community/kube-prometheus-stack \
  --namespace monitoring \
  --create-namespace \
  --values kube-prometheus-values.yaml
Verify the Installation
Check that all Prometheus components are running:
kubectl get pods -n monitoring
NAME                                                     READY   STATUS    RESTARTS       AGE
alertmanager-kube-prometheus-kube-prome-alertmanager-0   2/2     Running        0          60s
kube-prometheus-grafana-78ccf96696-sghx4                 3/3     Running        0          78s
kube-prometheus-kube-prome-operator-775fdbfd75-w88n7     1/1     Running        0          78s
kube-prometheus-kube-state-metrics-5bd5747f46-d2sxs      1/1     Running        0          78s
kube-prometheus-prometheus-node-exporter-ts9nn           1/1     Running        0          78s
prometheus-kube-prometheus-kube-prome-prometheus-0       2/2     Running        0          60s
Verify the Monitoring Status
Use MySQL protocol to query GreptimeDB and verify that Prometheus metrics are being written.
SHOW TABLES;
You should see tables created for various Prometheus metrics.
+---------------------------------------------------------------------------------+
| Tables                                                                          |
+---------------------------------------------------------------------------------+
| :node_memory_MemAvailable_bytes:sum                                             |
| ALERTS                                                                          |
| ALERTS_FOR_STATE                                                                |
| aggregator_discovery_aggregation_count_total                                    |
| aggregator_unavailable_apiservice                                               |
| alertmanager_alerts                                                             |
| alertmanager_alerts_invalid_total                                               |
| alertmanager_alerts_received_total                                              |
| alertmanager_build_info                                                         |
| ......                                                                          |
+---------------------------------------------------------------------------------+
1553 rows in set (0.18 sec)
Use Grafana for Visualization
Grafana is included in the kube-prometheus-stack and comes pre-configured with dashboards for comprehensive Kubernetes monitoring.
Access Grafana
Port-forward the Grafana service to access the web interface:
kubectl port-forward -n monitoring svc/kube-prometheus-grafana 3000:80
Get Admin Credentials
Retrieve the admin password using kubectl:
kubectl get secret --namespace monitoring kube-prometheus-grafana -o jsonpath="{.data.admin-password}" | base64 --decode ; echo
Login Grafana
- Open your browser and navigate to http://localhost:3000
- Login with:
- Username:
admin - Password: The password retrieved from the previous step
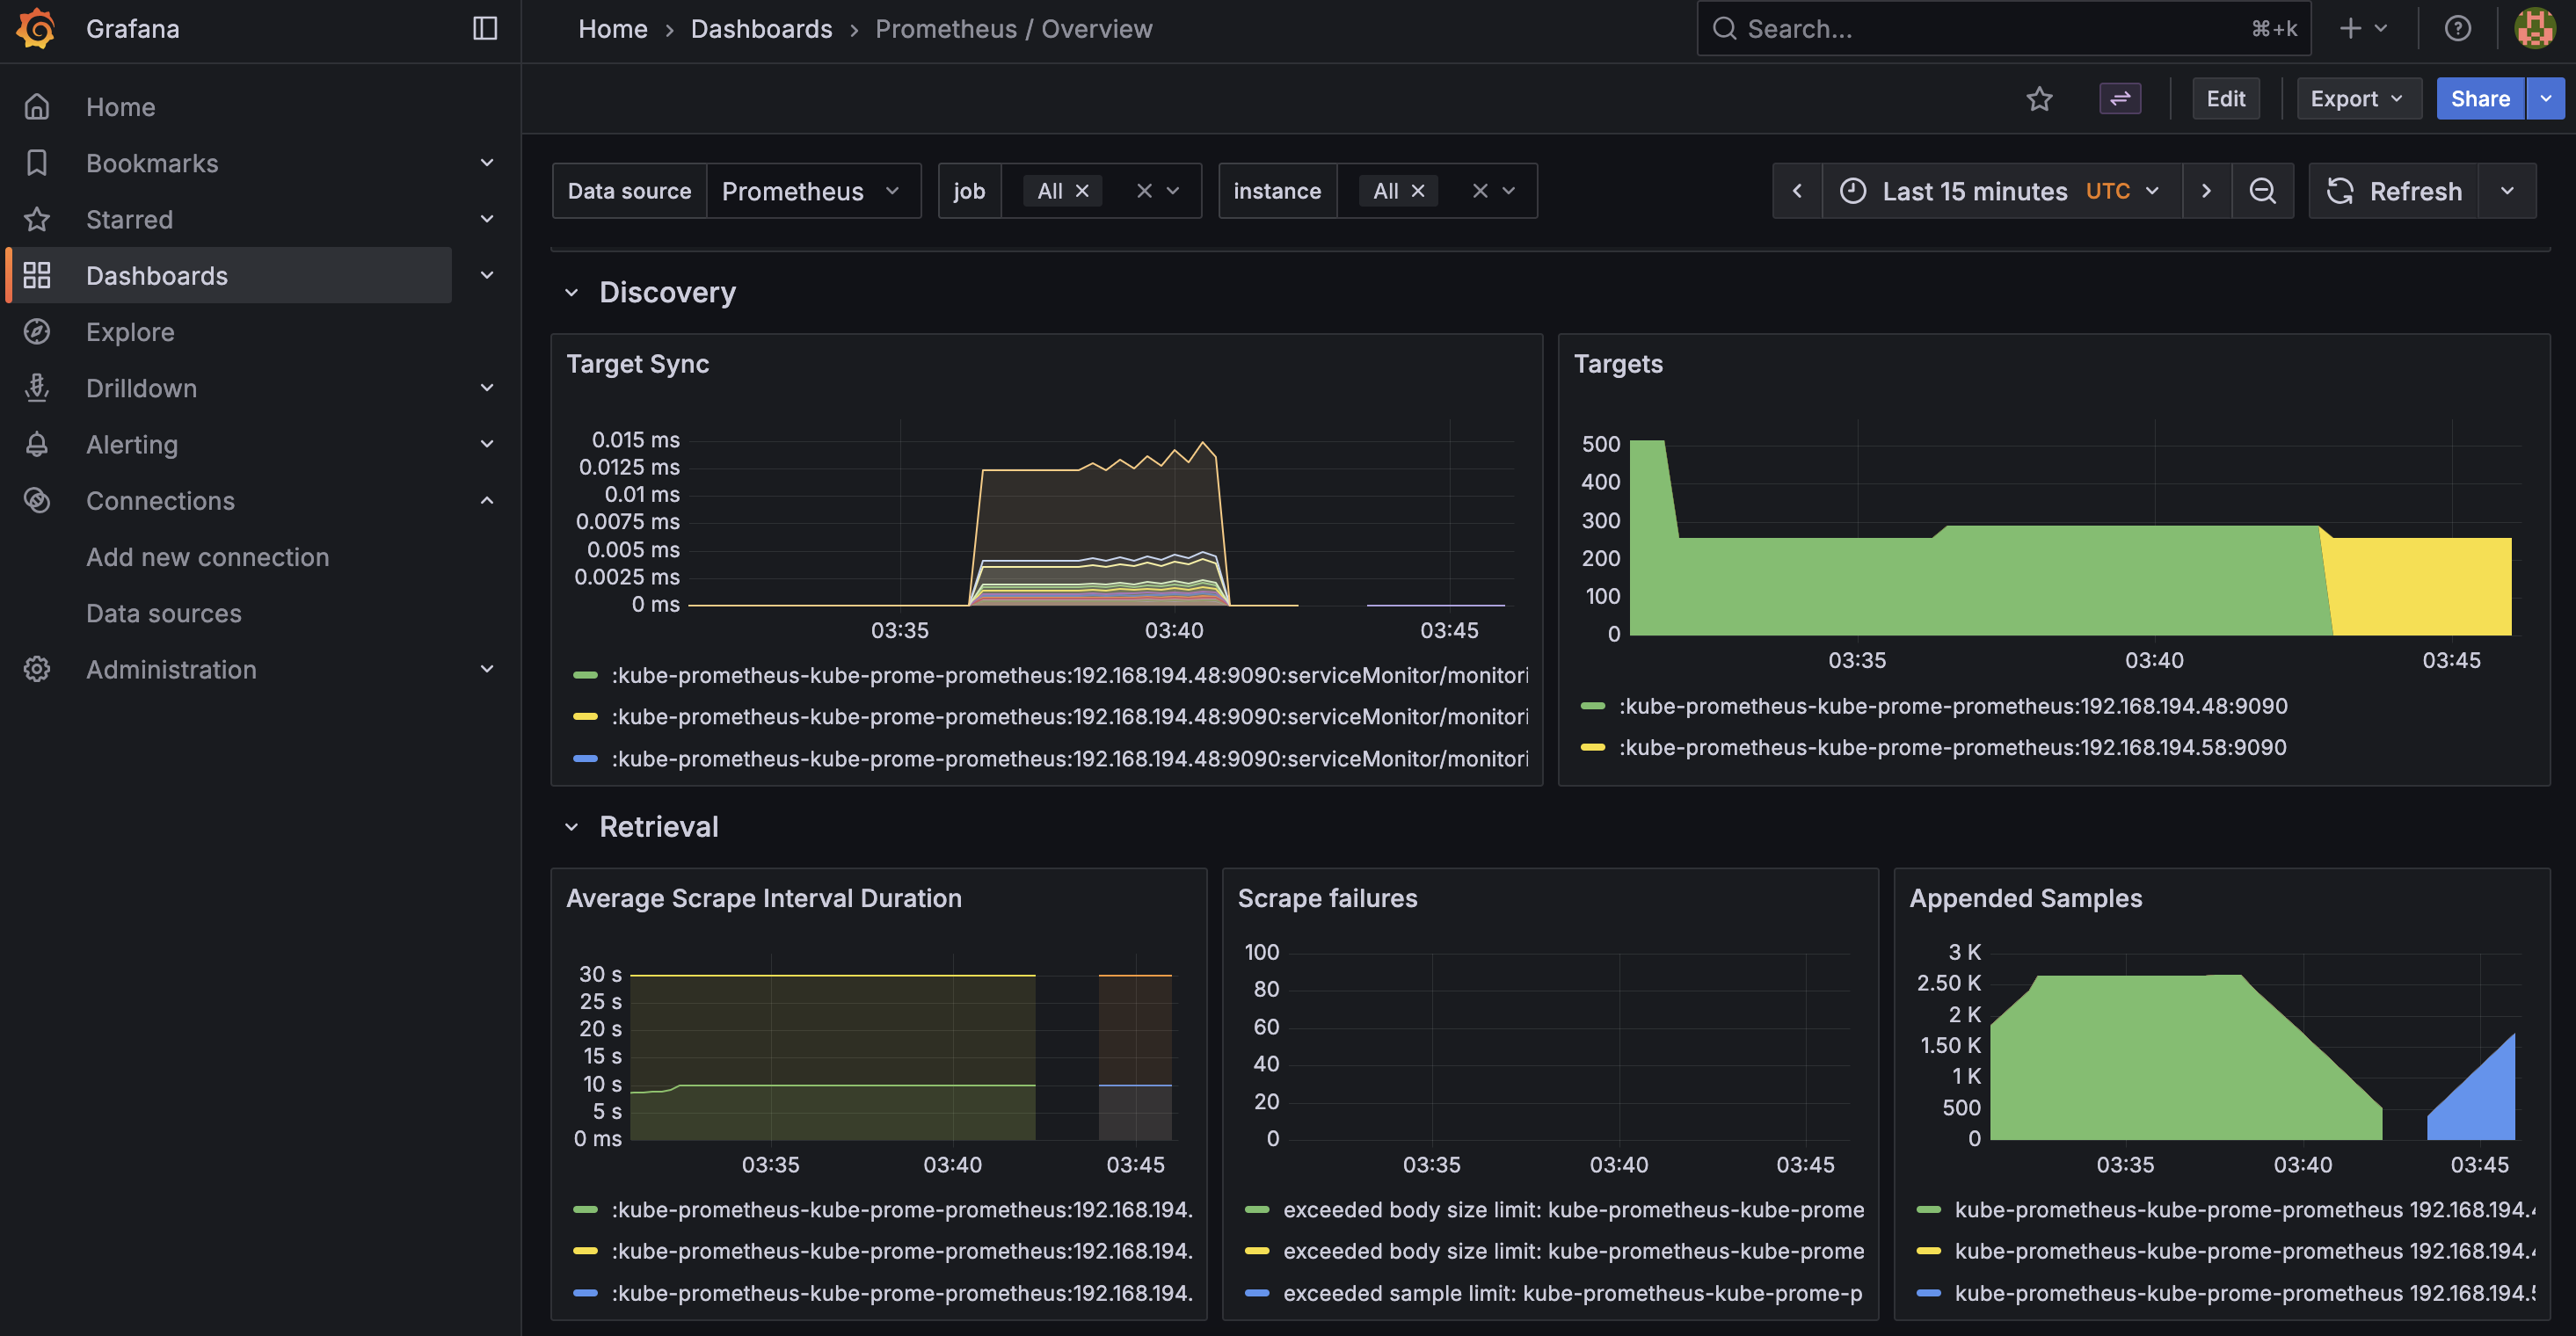
Explore Pre-configured Dashboards
After logging in, navigate to Dashboards to explore the pre-configured Kubernetes monitoring dashboards:
- Kubernetes / Compute Resources / Cluster: Overview of cluster-wide resource utilization
- Kubernetes / Compute Resources / Namespace (Pods): Resource usage breakdown by namespace
- Kubernetes / Compute Resources / Node (Pods): Node-level resource monitoring
- Node Exporter / Nodes: Detailed node hardware and OS metrics
Conclusion
You now have a complete Kubernetes monitoring solution with Prometheus collecting metrics and GreptimeDB providing efficient long-term storage. This setup enables you to:
- Monitor cluster and application health in real-time
- Store metrics for historical analysis and capacity planning
- Create rich visualizations and dashboards with Grafana
- Query metrics using both PromQL and SQL
For more information about GreptimeDB and Prometheus integration, see: