Coroot
Coroot is an open-source APM & Observability tool, a DataDog and NewRelic alternative. Metrics, logs, traces, continuous profiling, and SLO-based alerting, supercharged with predefined dashboards and inspections.
GreptimeDB can be configured as a Prometheus data sink for Coroot.
To integrate GreptimeDB with Coroot, navigate to Settings in the Coroot Dashboard,
select the Prometheus configuration, and enter the following information:
- Prometheus URL:
http{s}://<GreptimeDB_host>/v1/prometheus - If you have enabled authentication on GreptimeDB, check the HTTP basic auth option and enter GreptimeDB username and password. Otherwise, leave it unchecked.
- Remote Write URL:
http{s}://<GreptimeDB_host>/v1/prometheus/write?db=<db-name>
Example Configuration
If your GreptimeDB host is localhost with port 4000 for the HTTP service and authentication is enabled,
and you want to use the default database public,
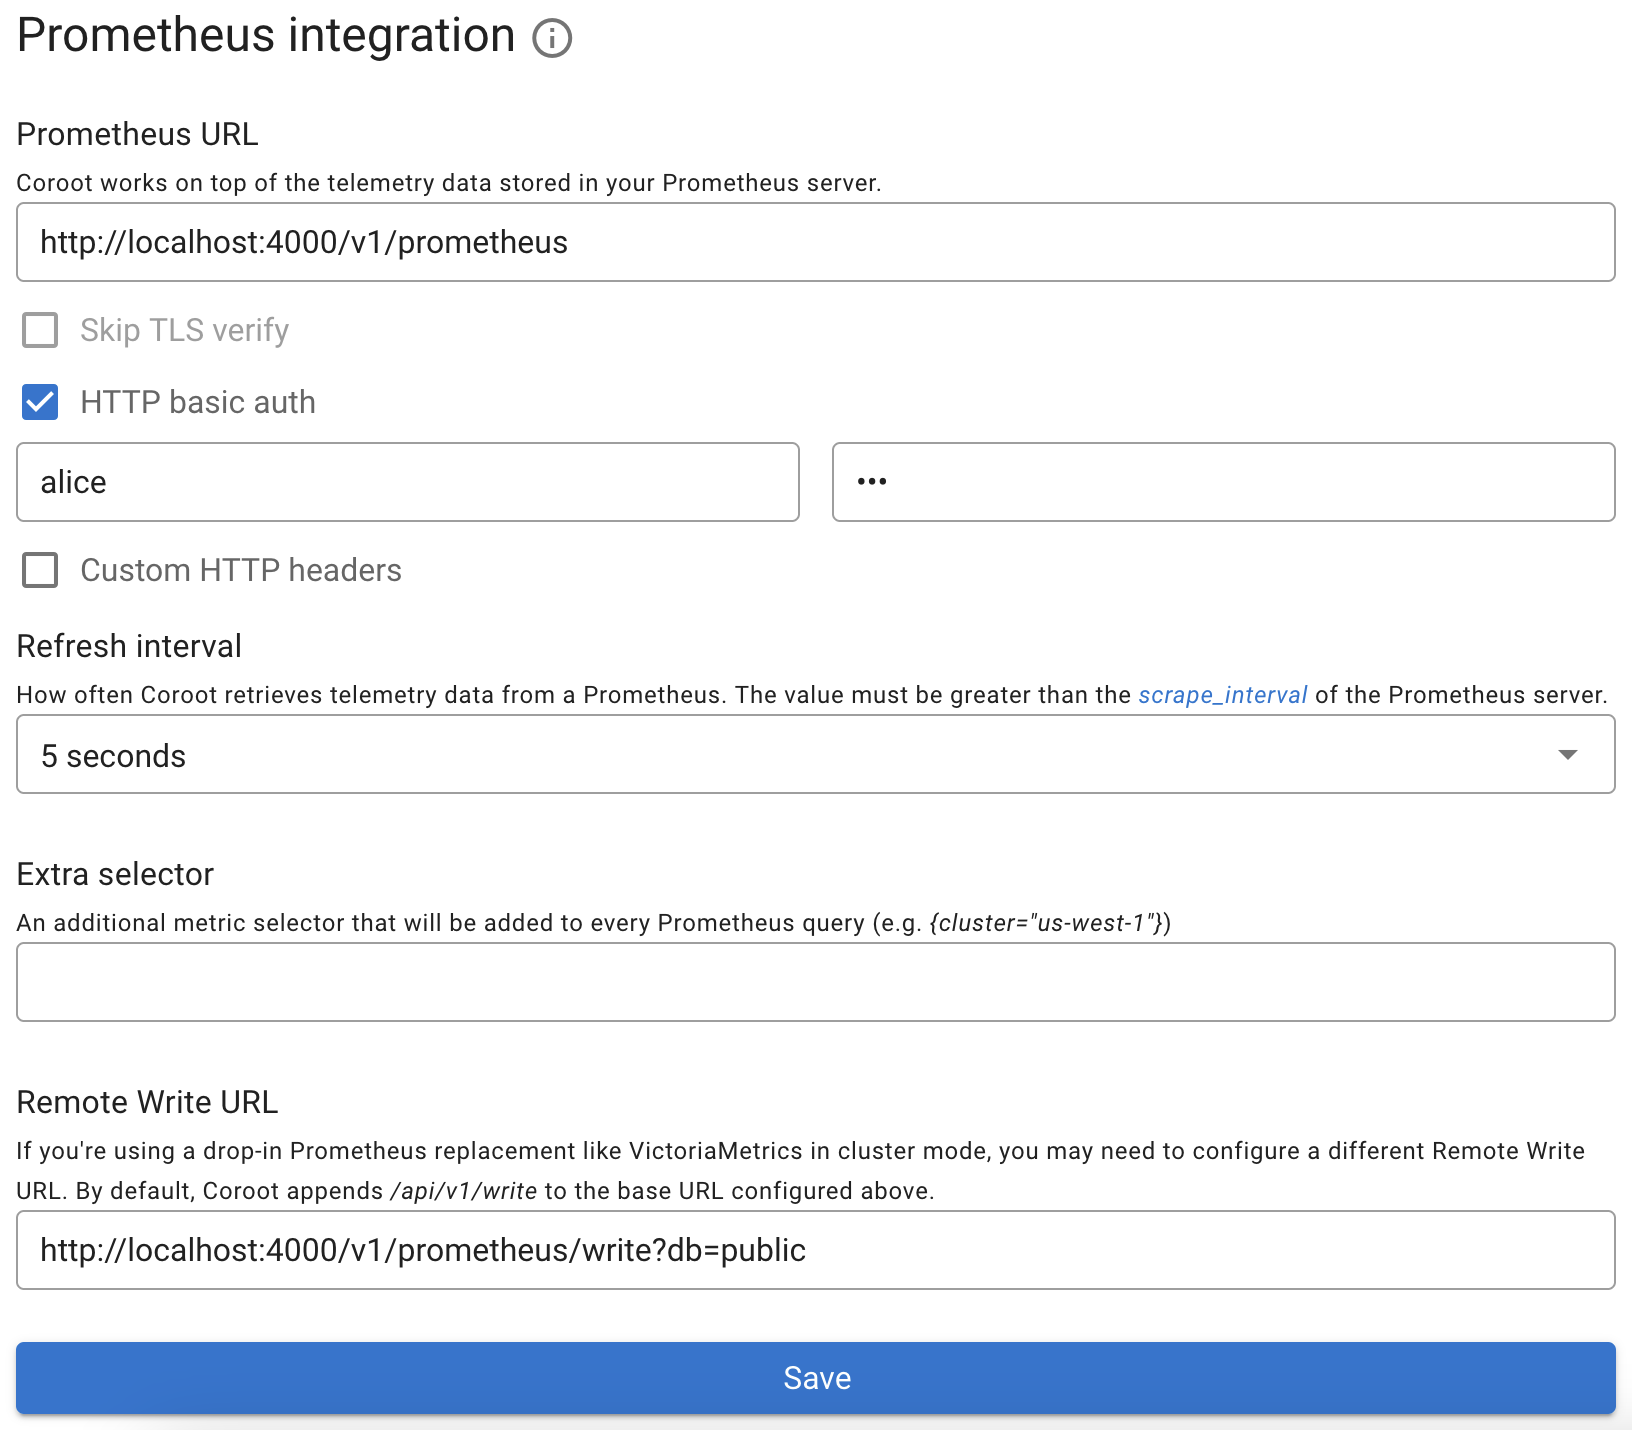
use the following configuration:
- Prometheus URL:
http://localhost:4000/v1/prometheus - Enable the HTTP basic auth option and enter GreptimeDB username and password
- Remote Write URL:
http://localhost:4000/v1/prometheus/write?db=public
The image below shows the Coroot configuration example:
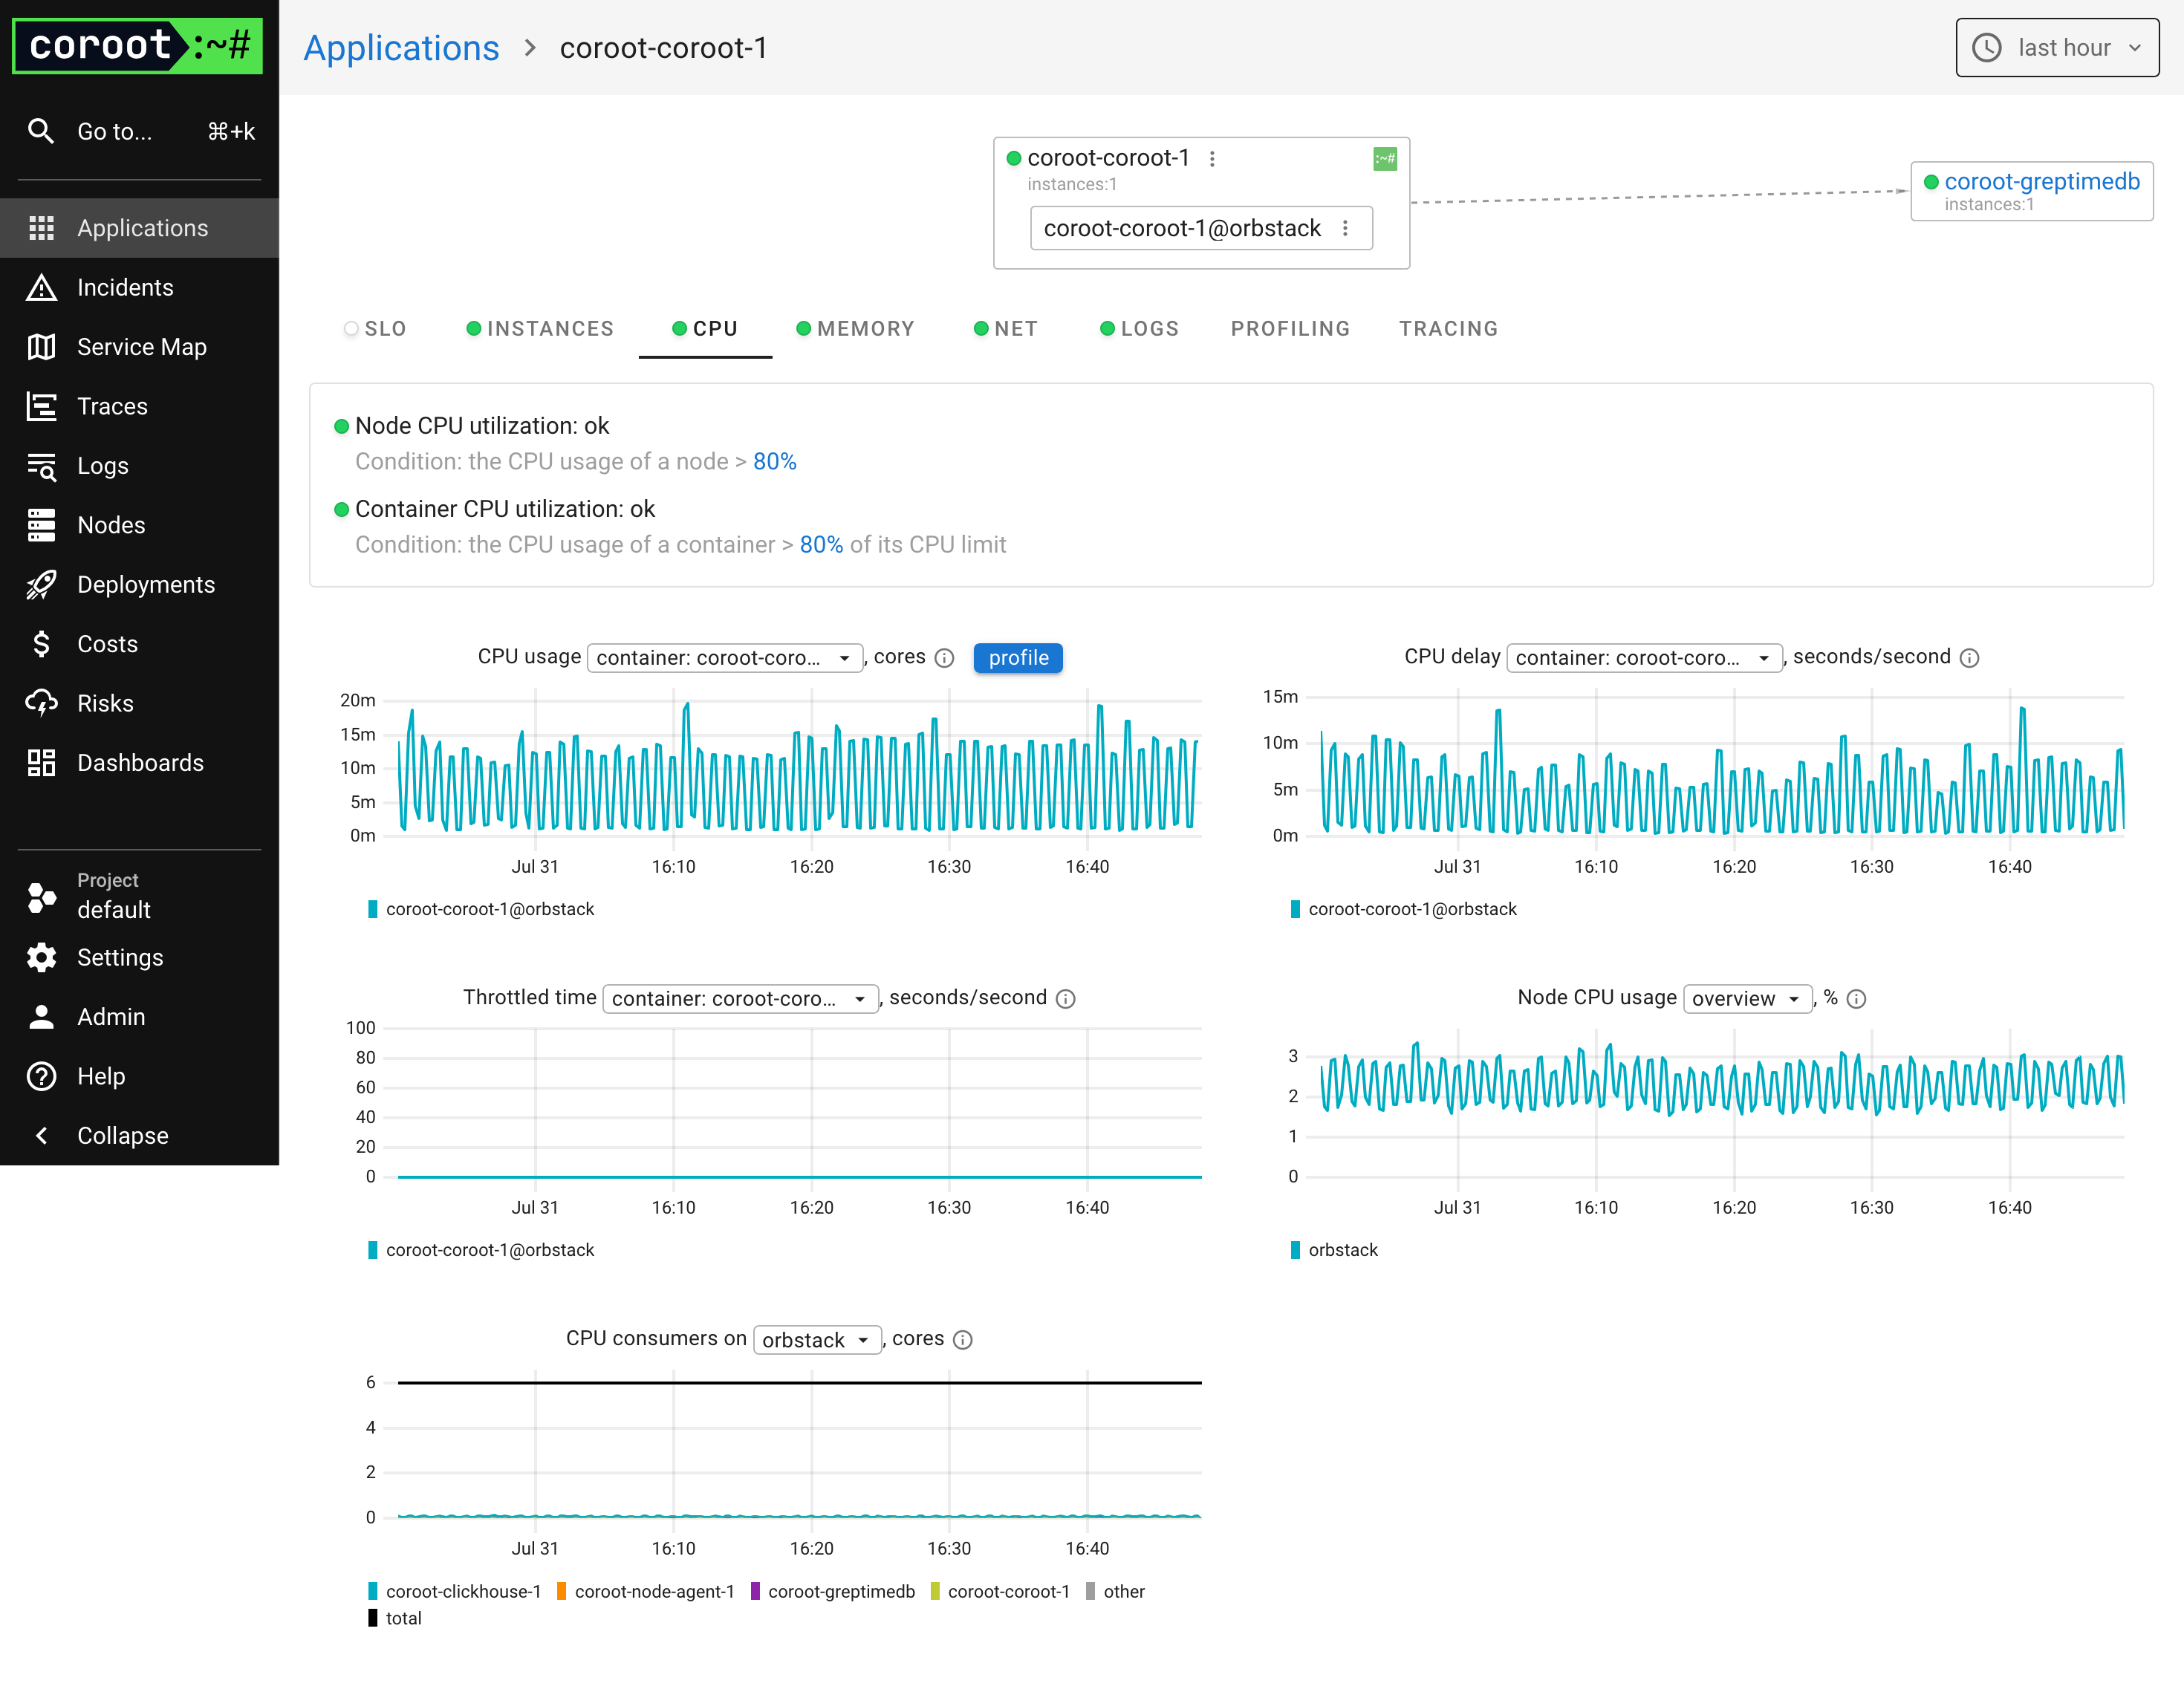
Once the configuration is saved successfully, you can begin using Coroot to monitor your instances. The image below shows an example of a Coroot dashboard using GreptimeDB as a data source: