Troubleshooting
When encountering errors or performance issues, you can understand GreptimeDB's status through metrics and logs. This information can also help further investigate the root causes of problems.
The following lists troubleshooting methods for some common abnormal situations. For cases where the cause cannot be easily identified, providing metrics and logs to the official team can also improve the efficiency of official troubleshooting.
Checking CPU and Memory Load
You can directly view the CPU and Memory load of corresponding components from the Dashboard. CPU is displayed in millicores, while Memory shows the current process RSS. You need to pay attention to whether the corresponding CPU and Memory load exceeds the Pod's Limit. If CPU has reached the Pod's Limit, throttling will be triggered, and clients will experience slower request processing. If Memory reaches over 70% of the Limit, it may result in OOM (Out of Memory).
Flow Creation Failure
When flow creation fails, one common scenario is that flownode is not deployed. You can check:
- Whether flownode is deployed in the cluster
- Whether the flownode status in the cluster is READY
If flownode is already deployed, you can further investigate by examining metasrv and flownode logs, or check whether the flow node was successfully created through internal tables:
select * from information_schema.cluster_info;
Object Storage Configuration Issues
When object storage is misconfigured, GreptimeDB will encounter exceptions when accessing object storage. If GreptimeDB hasn't stored any data, it generally doesn't need to access object storage, so errors might not be observable immediately after deployment. Once you create a table or start writing data to GreptimeDB through write protocols, you can observe request errors.
Typically, DB error messages will include object storage error details. You can find specific object storage error information through DB error logs. Some common error causes include:
- Incorrect Access Key or Secret Access Key
- Improper object storage permission configuration
- If using Tencent Cloud COS's S3-compatible API, since Tencent Cloud has disabled path-style domains, you need to set
enable_virtual_host_style = truein GreptimeDB's S3 configuration
For S3 as an example, GreptimeDB requires the following permissions:
"s3:PutObject",
"s3:ListBucket",
"s3:GetObject",
"s3:DeleteObject"
Low Write Throughput
You can observe write throughput through the Ingestion-related panels in the dashboard:
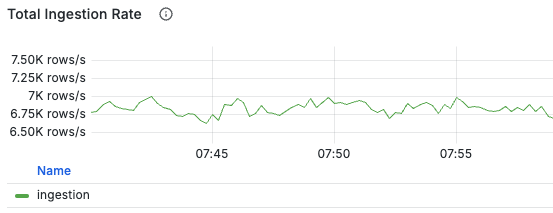
If write throughput is lower than expected load
it might be due to high write latency causing DB backlog.
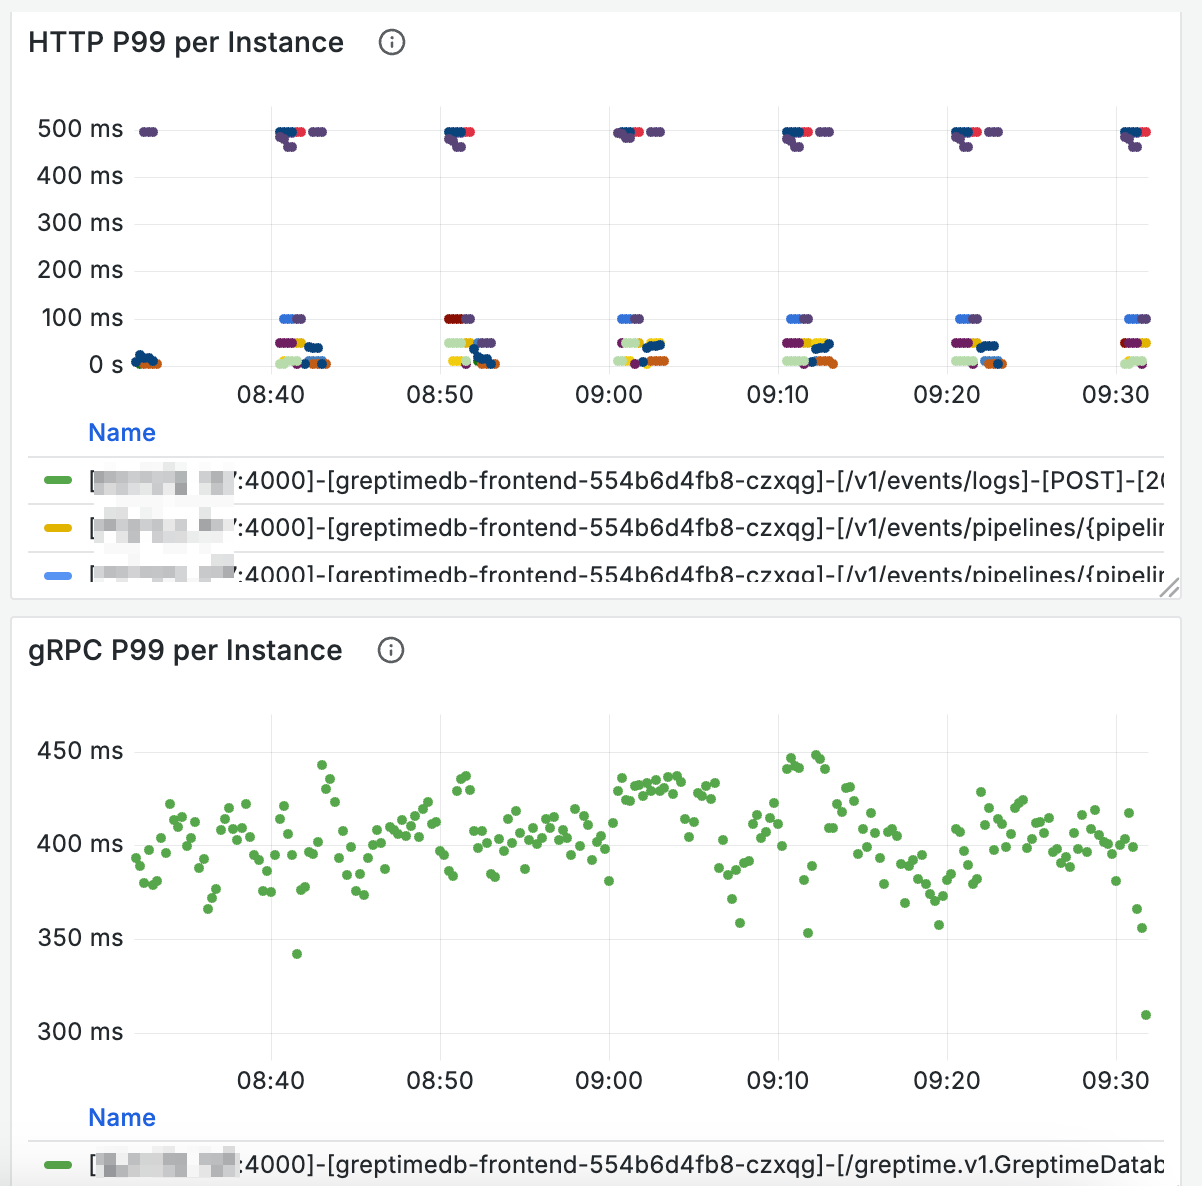
The dashboard provides panels in the Frontend Requests area to observe request latency:
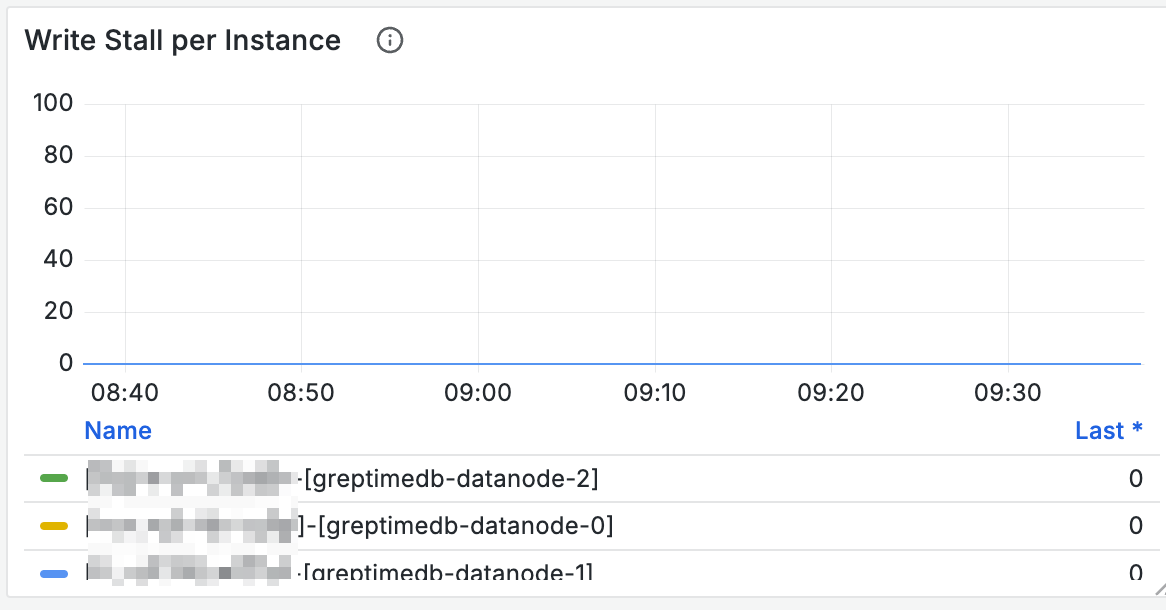
You can check if any nodes are experiencing stall through the Write Stall panel in the Mito Engine area (stall values remaining above 0 for extended periods).
If so, it indicates that node writes have encountered bottlenecks.
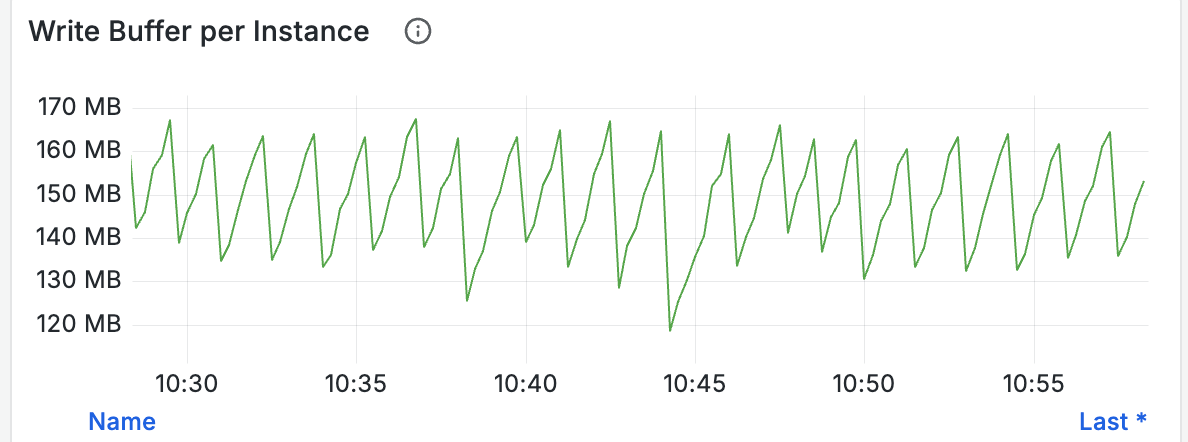
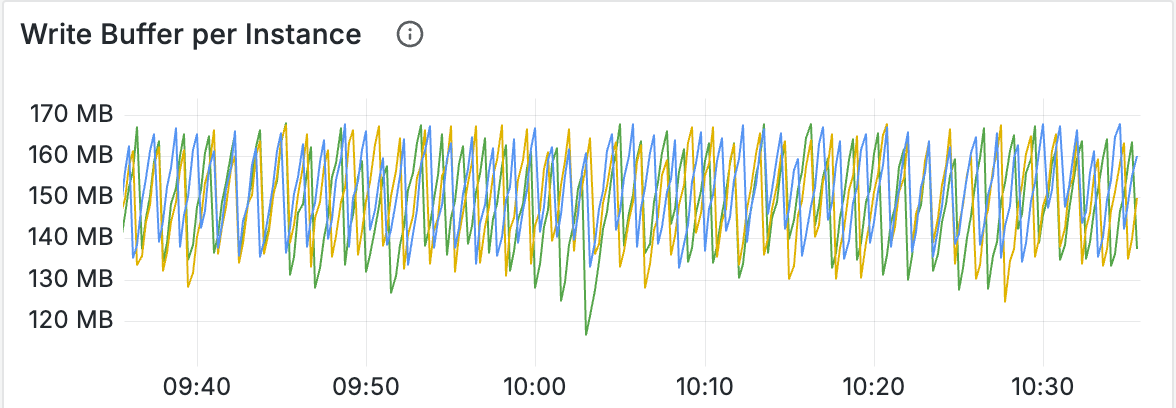
By observing the Write Buffer panel, you can also monitor size changes in buffers used for writing. If buffers fill up quickly, consider proportionally increasing global_write_buffer_size and global_write_buffer_reject_size:
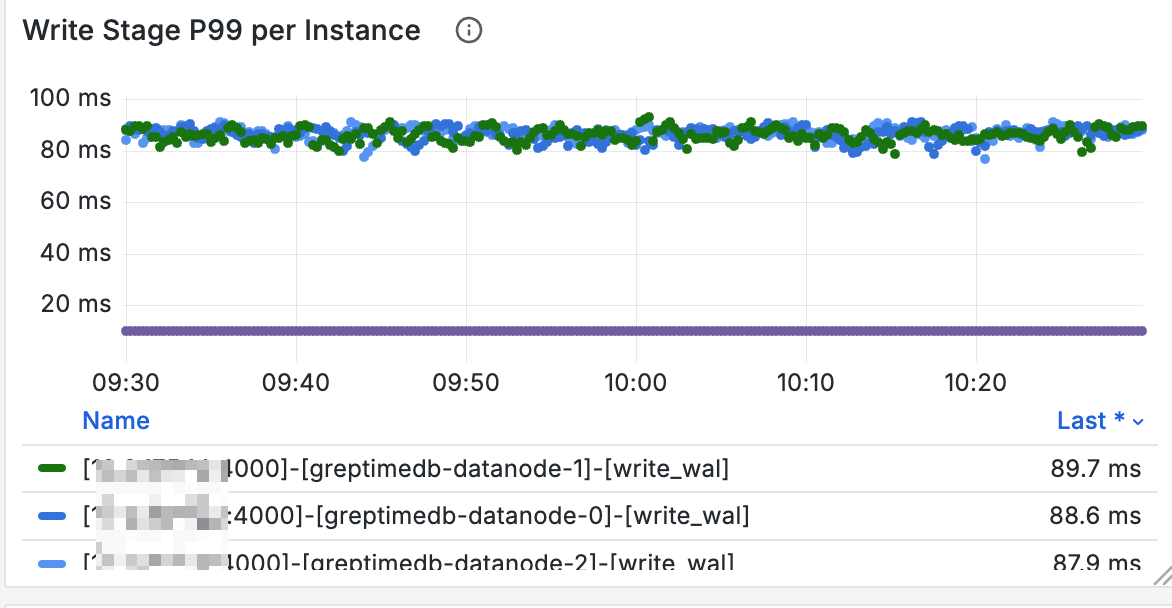
The Write Stage panel shows which stages have high write latency:
You can check background task status through Compaction/Flush related panels:
- Whether frequent flush operations occur; if so, consider proportionally increasing
global_write_buffer_sizeandglobal_write_buffer_reject_size - Whether there are long-running compaction and flush operations; if so, writes might be affected by these background tasks
Additionally, logs related to flush memtables can show the latency of individual flush operations.
High Memory Consumption During Writes
During DB write operations,
the total size of all memtables is estimated.
You can view memtable memory usage through the Write Buffer panel.
Note that these values might be smaller than the actual allocated memory.
If you notice that DB memory grows too quickly during writes, or if writes frequently encounter OOM situations, this might be related to unreasonable table schema design.
A common cause is improper Primary Key design.
If there are too many primary keys,
it will consume excessive memory during writes,
potentially causing database memory usage to become too high.
In such cases, Write Buffer often remains at high levels.
Increasing write buffer size generally won't improve this issue;
you need to reduce the number of primary key columns or remove high-cardinality primary key columns.
High Query Latency
If query latency is high,
you can add EXPLAIN ANALYZE or EXPLAIN ANALYZE VERBOSE before the query and re-execute it.
The query results will include execution time for each stage to assist in troubleshooting.
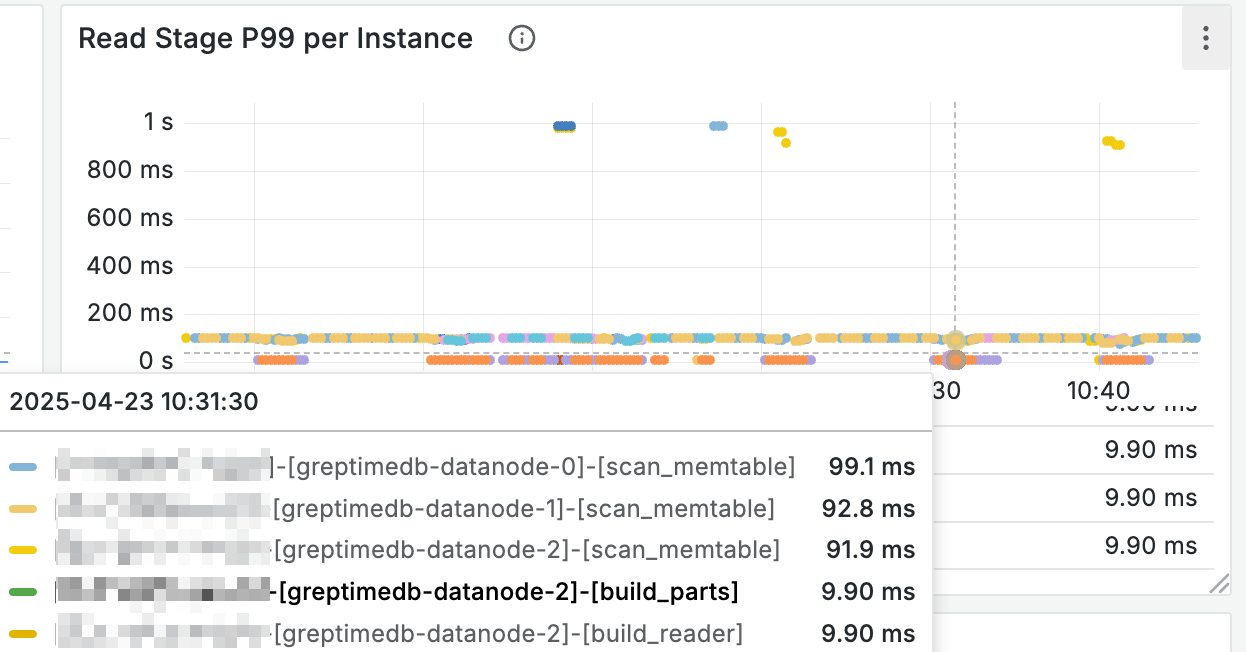
Additionally, the Read Stage panel can help understand query latency across different stages:
Cache Full
To understand the size of various caches,
you can check the used size of different caches on nodes through the Cached Bytes panel:
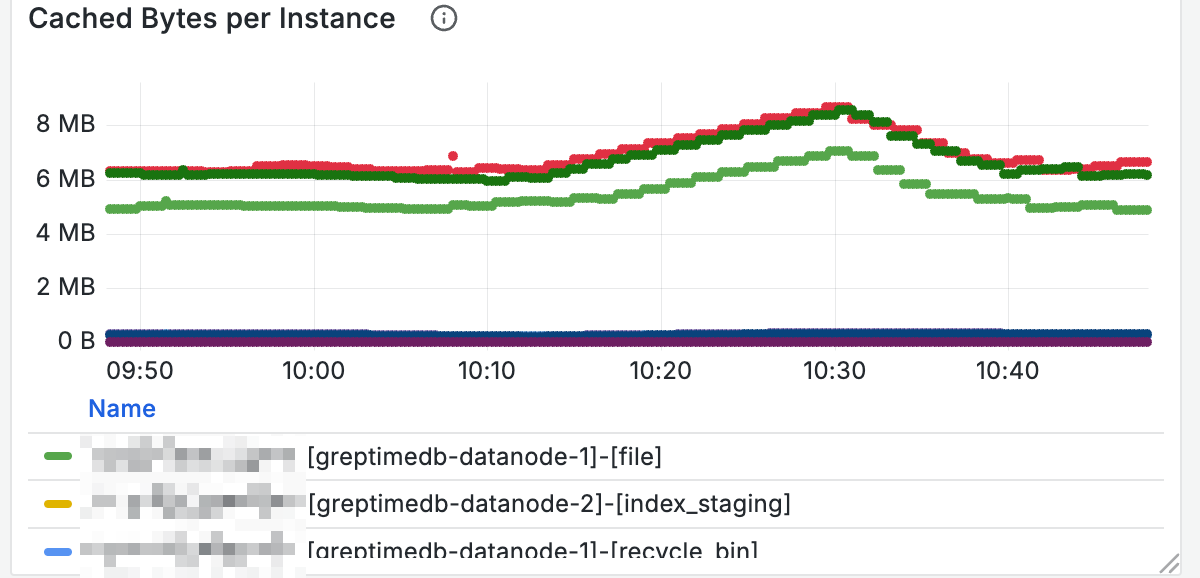
For nodes with high query latency, you can also determine if caches are full by checking cache sizes.
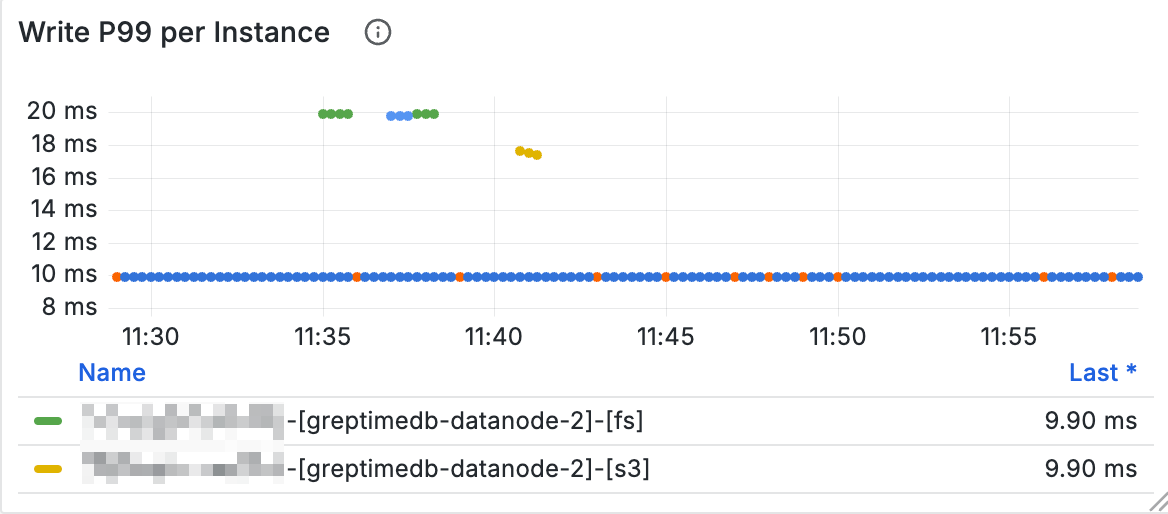
Object Storage Latency
You can view object storage operation latency through panels in the OpenDAL area of the dashboard.
For example, the following panel shows response latency for object storage write operations:
If you suspect object storage operations are experiencing jitter, you can observe the related panels.