Quick Start
Before proceeding, please ensure you have installed GreptimeDB.
This guide uses SQL to walk you through GreptimeDB's core capabilities — from ingestion to cross-signal correlation across metrics, logs, and traces. SQL is also GreptimeDB's management interface for creating tables, setting TTL policies, and configuring indexes.
You can start ingesting data immediately using your existing tools — no schema creation needed (GreptimeDB creates tables automatically):
Continue with this guide to see what you can do with the data once it's in.
You'll learn (10–15 minutes):
- Connect to GreptimeDB and create metrics, logs, and traces tables
- Query and aggregate data with SQL
- Search logs by keyword with full-text index
- Compute p95 latency in time windows using range queries
- Correlate metrics, logs, and traces in a single query
- Combine SQL and PromQL
Connect to GreptimeDB
GreptimeDB supports multiple protocols for interacting with the database. In this guide, we use SQL for simplicity.
If your GreptimeDB instance is running on 127.0.0.1 with the MySQL client default port 4002 or the PostgreSQL client default port 4003, connect using:
mysql -h 127.0.0.1 -P 4002
Or
psql -h 127.0.0.1 -p 4003 -d public
You can also use the built-in Dashboard at http://127.0.0.1:4000/dashboard to run all the SQL queries in this guide.
By default, GreptimeDB does not have authentication enabled. You can connect without providing a username and password.
Create tables
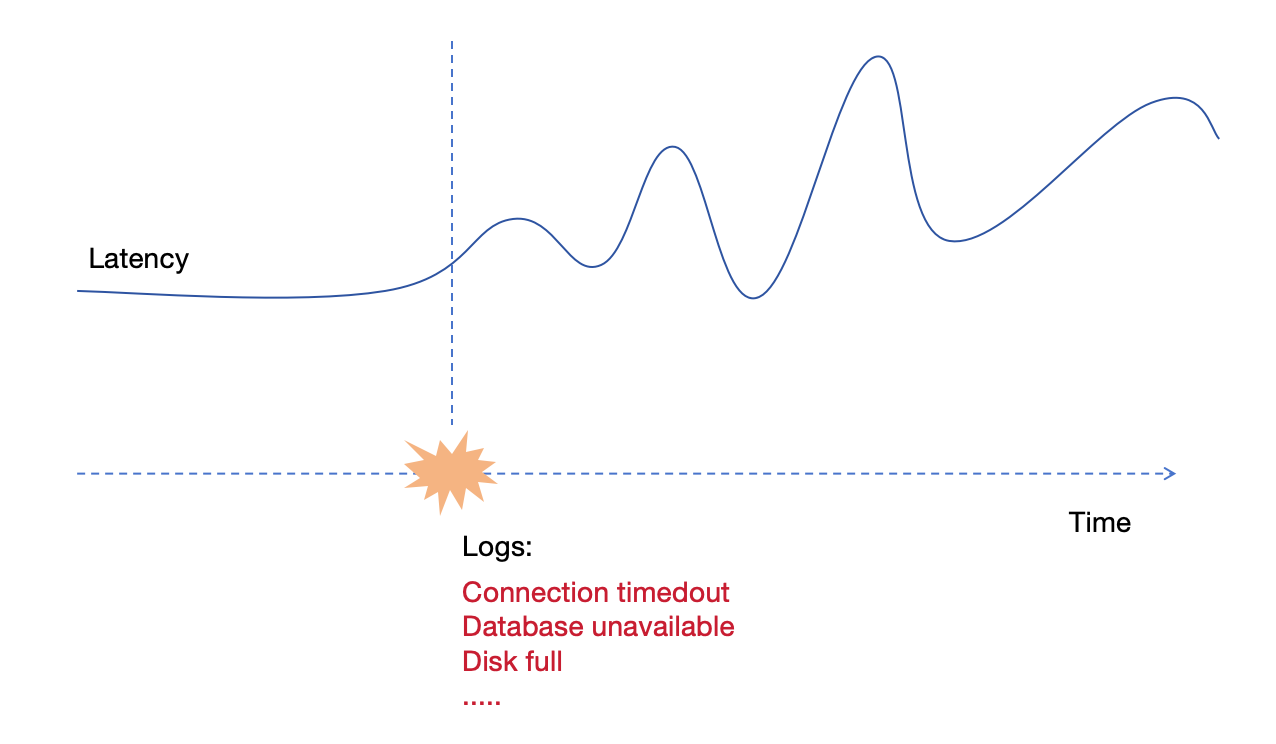
We'll create three tables to simulate a real scenario: gRPC latency metrics, application logs, and request traces. Two application servers, host1 and host2, are recording data. Starting from 2024-07-11 20:00:10, host1 begins experiencing issues.
Metrics table
-- Metrics: gRPC call latency in milliseconds
CREATE TABLE grpc_latencies (
  ts TIMESTAMP TIME INDEX,
  host STRING,
  method_name STRING,
  latency DOUBLE,
  PRIMARY KEY (host, method_name)
);
ts: Timestamp when the metric was collected (the time index).hostandmethod_name: Tag columns identifying the time series.latency: Field column containing the actual measurement.
Logs table
-- Logs: application error logs
CREATE TABLE app_logs (
  ts TIMESTAMP TIME INDEX,
  host STRING,
  api_path STRING,
  log_level STRING,
  log_msg STRING FULLTEXT INDEX WITH('case_sensitive' = 'false'),
  PRIMARY KEY (host, log_level)
) WITH ('append_mode'='true');
log_msgenables full-text index for keyword search.append_modeoptimizes for log workloads (no deduplication overhead).
Traces table
-- Traces: request spans
CREATE TABLE traces (
  ts TIMESTAMP TIME INDEX,
  trace_id STRING SKIPPING INDEX,
  span_id STRING,
  parent_span_id STRING,
  service_name STRING,
  operation STRING,
  duration DOUBLE,
  status_code INT,
  PRIMARY KEY (service_name)
) WITH ('append_mode'='true');
For high-cardinality trace_ids, we have enabled the skip index.
We use SQL to ingest data below, so we create the tables manually. However, GreptimeDB is schemaless — when using protocols like OpenTelemetry, Prometheus Remote Write, or InfluxDB Line Protocol, tables are created automatically.
Write data
Let's insert sample data simulating the scenario. Before 20:00:10, both hosts are normal. After 20:00:10, host1 starts experiencing latency spikes.
Normal period (before 20:00:10)
INSERT INTO grpc_latencies (ts, host, method_name, latency) VALUES
  ('2024-07-11 20:00:06', 'host1', 'GetUser', 103.0),
  ('2024-07-11 20:00:06', 'host2', 'GetUser', 113.0),
  ('2024-07-11 20:00:07', 'host1', 'GetUser', 103.5),
  ('2024-07-11 20:00:07', 'host2', 'GetUser', 107.0),
  ('2024-07-11 20:00:08', 'host1', 'GetUser', 104.0),
  ('2024-07-11 20:00:08', 'host2', 'GetUser', 96.0),
  ('2024-07-11 20:00:09', 'host1', 'GetUser', 104.5),
  ('2024-07-11 20:00:09', 'host2', 'GetUser', 114.0);
Anomalous period (after 20:00:10)
host1's latency becomes unstable with spikes up to several thousand milliseconds:
Click to expand INSERT statements
INSERT INTO grpc_latencies (ts, host, method_name, latency) VALUES
  ('2024-07-11 20:00:10', 'host1', 'GetUser', 150.0),
  ('2024-07-11 20:00:10', 'host2', 'GetUser', 110.0),
  ('2024-07-11 20:00:11', 'host1', 'GetUser', 200.0),
  ('2024-07-11 20:00:11', 'host2', 'GetUser', 102.0),
  ('2024-07-11 20:00:12', 'host1', 'GetUser', 1000.0),
  ('2024-07-11 20:00:12', 'host2', 'GetUser', 108.0),
  ('2024-07-11 20:00:13', 'host1', 'GetUser', 80.0),
  ('2024-07-11 20:00:13', 'host2', 'GetUser', 111.0),
  ('2024-07-11 20:00:14', 'host1', 'GetUser', 4200.0),
  ('2024-07-11 20:00:14', 'host2', 'GetUser', 95.0),
  ('2024-07-11 20:00:15', 'host1', 'GetUser', 90.0),
  ('2024-07-11 20:00:15', 'host2', 'GetUser', 115.0),
  ('2024-07-11 20:00:16', 'host1', 'GetUser', 3000.0),
  ('2024-07-11 20:00:16', 'host2', 'GetUser', 95.0),
  ('2024-07-11 20:00:17', 'host1', 'GetUser', 320.0),
  ('2024-07-11 20:00:17', 'host2', 'GetUser', 115.0),
  ('2024-07-11 20:00:18', 'host1', 'GetUser', 3500.0),
  ('2024-07-11 20:00:18', 'host2', 'GetUser', 95.0),
  ('2024-07-11 20:00:19', 'host1', 'GetUser', 100.0),
  ('2024-07-11 20:00:19', 'host2', 'GetUser', 115.0),
  ('2024-07-11 20:00:20', 'host1', 'GetUser', 2500.0),
  ('2024-07-11 20:00:20', 'host2', 'GetUser', 95.0);
Error logs during the anomaly
INSERT INTO app_logs (ts, host, api_path, log_level, log_msg) VALUES
  ('2024-07-11 20:00:10', 'host1', '/api/v1/resource', 'ERROR', 'Connection timeout'),
  ('2024-07-11 20:00:10', 'host1', '/api/v1/billings', 'ERROR', 'Connection timeout'),
  ('2024-07-11 20:00:11', 'host1', '/api/v1/resource', 'ERROR', 'Database unavailable'),
  ('2024-07-11 20:00:11', 'host1', '/api/v1/billings', 'ERROR', 'Database unavailable'),
  ('2024-07-11 20:00:12', 'host1', '/api/v1/resource', 'ERROR', 'Service overload'),
  ('2024-07-11 20:00:12', 'host1', '/api/v1/billings', 'ERROR', 'Service overload'),
  ('2024-07-11 20:00:13', 'host1', '/api/v1/resource', 'ERROR', 'Connection reset'),
  ('2024-07-11 20:00:13', 'host1', '/api/v1/billings', 'ERROR', 'Connection reset'),
  ('2024-07-11 20:00:14', 'host1', '/api/v1/resource', 'ERROR', 'Timeout'),
  ('2024-07-11 20:00:14', 'host1', '/api/v1/billings', 'ERROR', 'Timeout'),
  ('2024-07-11 20:00:15', 'host1', '/api/v1/resource', 'ERROR', 'Disk full'),
  ('2024-07-11 20:00:15', 'host1', '/api/v1/billings', 'ERROR', 'Disk full'),
  ('2024-07-11 20:00:16', 'host1', '/api/v1/resource', 'ERROR', 'Network issue'),
  ('2024-07-11 20:00:16', 'host1', '/api/v1/billings', 'ERROR', 'Network issue');
Trace spans during the anomaly
INSERT INTO traces (ts, trace_id, span_id, parent_span_id, service_name, operation, duration, status_code) VALUES
  ('2024-07-11 20:00:12', 'abc123', 'span1', '', 'host1', 'POST /api/v1/resource', 1050.0, 2),
  ('2024-07-11 20:00:12', 'abc123', 'span2', 'span1', 'host1', 'GetUser', 1000.0, 2),
  ('2024-07-11 20:00:14', 'def456', 'span3', '', 'host1', 'POST /api/v1/billings', 4250.0, 2),
  ('2024-07-11 20:00:14', 'def456', 'span4', 'span3', 'host1', 'CreateBilling', 4200.0, 2),
  ('2024-07-11 20:00:16', 'ghi789', 'span5', '', 'host1', 'POST /api/v1/resource', 3100.0, 2),
  ('2024-07-11 20:00:16', 'ghi789', 'span6', 'span5', 'host1', 'GetUser', 3000.0, 2),
  ('2024-07-11 20:00:12', 'jkl012', 'span7', '', 'host2', 'POST /api/v1/resource', 115.0, 0),
  ('2024-07-11 20:00:12', 'jkl012', 'span8', 'span7', 'host2', 'GetUser', 108.0, 0);
Query data
Filter by tags and time index
Query the latency of host1 after 2024-07-11 20:00:15:
SELECT *
FROM grpc_latencies
WHERE host = 'host1' AND ts > '2024-07-11 20:00:15';
+---------------------+-------+-------------+---------+
| ts                  | host  | method_name | latency |
+---------------------+-------+-------------+---------+
| 2024-07-11 20:00:16 | host1 | GetUser     |    3000 |
| 2024-07-11 20:00:17 | host1 | GetUser     |     320 |
| 2024-07-11 20:00:18 | host1 | GetUser     |    3500 |
| 2024-07-11 20:00:19 | host1 | GetUser     |     100 |
| 2024-07-11 20:00:20 | host1 | GetUser     |    2500 |
+---------------------+-------+-------------+---------+
5 rows in set (0.14 sec)
Calculate the 95th percentile latency grouped by host:
SELECT
  host,
  approx_percentile_cont(0.95) WITHIN GROUP (ORDER BY latency) AS p95_latency
FROM grpc_latencies
WHERE ts >= '2024-07-11 20:00:10'
GROUP BY host;
+-------+-------------------+
| host  | p95_latency       |
+-------+-------------------+
| host1 | 4164.999999999999 |
| host2 |               115 |
+-------+-------------------+
2 rows in set (0.11 sec)
Search logs by keyword
The @@ operator performs full-text search on indexed columns:
SELECT *
FROM app_logs
WHERE lower(log_msg) @@ 'timeout'
  AND ts > '2024-07-11 20:00:00'
ORDER BY ts;
+---------------------+-------+------------------+-----------+--------------------+
| ts                  | host  | api_path         | log_level | log_msg            |
+---------------------+-------+------------------+-----------+--------------------+
| 2024-07-11 20:00:10 | host1 | /api/v1/billings | ERROR     | Connection timeout |
| 2024-07-11 20:00:10 | host1 | /api/v1/resource | ERROR     | Connection timeout |
| 2024-07-11 20:00:14 | host1 | /api/v1/billings | ERROR     | Timeout            |
| 2024-07-11 20:00:14 | host1 | /api/v1/resource | ERROR     | Timeout            |
+---------------------+-------+------------------+-----------+--------------------+
Range query
Use range queries to calculate the p95 latency in 5-second windows:
SELECT
  ts,
  host,
  approx_percentile_cont(0.95) WITHIN GROUP (ORDER BY latency)
    RANGE '5s' AS p95_latency
FROM grpc_latencies
ALIGN '5s' FILL PREV
ORDER BY host, ts;
+---------------------+-------+-------------+
| ts                  | host  | p95_latency |
+---------------------+-------+-------------+
| 2024-07-11 20:00:05 | host1 |       104.5 |
| 2024-07-11 20:00:10 | host1 |        4200 |
| 2024-07-11 20:00:15 | host1 |        3500 |
| 2024-07-11 20:00:20 | host1 |        2500 |
| 2024-07-11 20:00:05 | host2 |         114 |
| 2024-07-11 20:00:10 | host2 |         111 |
| 2024-07-11 20:00:15 | host2 |         115 |
| 2024-07-11 20:00:20 | host2 |          95 |
+---------------------+-------+-------------+
8 rows in set (0.06 sec)
Range queries are powerful for time-window aggregation. Read the manual to learn more.
Correlate metrics, logs, and traces
This is where a unified database shines. One query to correlate p95 latency, error counts, and slow trace spans — across all three signal types:
WITH
  -- Metrics: per-host p95 latency in 5s windows
  metrics AS (
    SELECT
      ts, host,
      approx_percentile_cont(0.95) WITHIN GROUP (ORDER BY latency)
        RANGE '5s' AS p95_latency
    FROM grpc_latencies
    ALIGN '5s' FILL PREV
  ),
  -- Logs: per-host ERROR count in 5s windows
  logs AS (
    SELECT
      ts, host,
      count(log_msg) RANGE '5s' AS num_errors
    FROM app_logs
    WHERE log_level = 'ERROR'
    ALIGN '5s'
  ),
  -- Traces: per-host slow span count in 5s windows
  slow_traces AS (
    SELECT
      date_bin(INTERVAL '5' seconds, ts) AS ts,
      service_name AS host,
      COUNT(*) AS slow_spans,
      MAX(duration) AS max_span_duration
    FROM traces
    WHERE duration > 500
    GROUP BY date_bin(INTERVAL '5' seconds, ts), service_name
  )
SELECT
  m.ts,
  m.host,
  m.p95_latency,
  COALESCE(l.num_errors, 0) AS num_errors,
  COALESCE(t.slow_spans, 0) AS slow_spans,
  t.max_span_duration
FROM metrics m
LEFT JOIN logs l ON m.host = l.host AND m.ts = l.ts
LEFT JOIN slow_traces t ON m.host = t.host AND m.ts = t.ts
ORDER BY m.ts, m.host;
+---------------------+-------+-------------+------------+------------+-------------------+
| ts                  | host  | p95_latency | num_errors | slow_spans | max_span_duration |
+---------------------+-------+-------------+------------+------------+-------------------+
| 2024-07-11 20:00:05 | host1 |       104.5 |          0 |          0 |              NULL |
| 2024-07-11 20:00:05 | host2 |         114 |          0 |          0 |              NULL |
| 2024-07-11 20:00:10 | host1 |        4200 |         10 |          4 |              4250 |
| 2024-07-11 20:00:10 | host2 |         111 |          0 |          0 |              NULL |
| 2024-07-11 20:00:15 | host1 |        3500 |          4 |          2 |              3100 |
| 2024-07-11 20:00:15 | host2 |         115 |          0 |          0 |              NULL |
| 2024-07-11 20:00:20 | host1 |        2500 |          0 |          0 |              NULL |
| 2024-07-11 20:00:20 | host2 |          95 |          0 |          0 |              NULL |
+---------------------+-------+-------------+------------+------------+-------------------+
8 rows in set (0.02 sec)
The picture is clear: during the 20:00:10 – 20:00:15 window, host1 experienced p95 latency spikes (up to 4200ms), 10 error logs, and 4 slow trace spans (max 4250ms). host2 was unaffected. In a traditional three-pillar stack, this correlation requires switching between Prometheus, Loki, and Jaeger. With GreptimeDB, it's one query.
Query with PromQL
GreptimeDB natively supports PromQL. In the Dashboard, switch to the PromQL tab and run:
quantile_over_time(0.95, grpc_latencies{host!=""}[5s])
You can also query via the Prometheus-compatible HTTP API:
curl -X POST \
  -H 'Authorization: Basic <base64-encoded-credentials>' \
  --data-urlencode 'query=quantile_over_time(0.95, grpc_latencies{host!=""}[5s])' \
  --data-urlencode 'start=2024-07-11 20:00:00Z' \
  --data-urlencode 'end=2024-07-11 20:00:20Z' \
  --data-urlencode 'step=15s' \
  'http://localhost:4000/v1/prometheus/api/v1/query_range'
Output
{
  "status": "success",
  "data": {
    "resultType": "matrix",
    "result": [
      {
        "metric": {
          "__name__": "grpc_latencies",
          "host": "host1",
          "method_name": "GetUser"
        },
        "values": [
          [
            1720728015.0,
            "3560"
          ]
        ]
      },
      {
        "metric": {
          "__name__": "grpc_latencies",
          "host": "host2",
          "method_name": "GetUser"
        },
        "values": [
          [
            1720728015.0,
            "114.2"
          ]
        ]
      }
    ]
  }
}
Mix SQL and PromQL
Use TQL to embed PromQL inside SQL — combining the power of both:
TQL EVAL ('2024-07-11 20:00:00Z', '2024-07-11 20:00:20Z', '15s')
    quantile_over_time(0.95, grpc_latencies{host!=""}[5s]);
+---------------------+---------------------------------------------------------+-------+-------------+
| ts                  | prom_quantile_over_time(ts_range,latency,Float64(0.95)) | host  | method_name |
+---------------------+---------------------------------------------------------+-------+-------------+
| 2024-07-11 20:00:15 |                                                    3560 | host1 | GetUser     |
| 2024-07-11 20:00:15 |                                                   114.2 | host2 | GetUser     |
+---------------------+---------------------------------------------------------+-------+-------------+
You can even use PromQL as a CTE in a correlation query:
WITH
  metrics AS (
    TQL EVAL ('2024-07-11 20:00:00Z', '2024-07-11 20:00:20Z', '5s')
      quantile_over_time(0.95, grpc_latencies{host!=""}[5s])
  ),
  logs AS (
    SELECT
      ts, host,
      COUNT(log_msg) RANGE '5s' AS num_errors
    FROM app_logs
    WHERE log_level = 'ERROR'
    ALIGN '5s'
  )
SELECT
  m.*,
  COALESCE(l.num_errors, 0) AS num_errors
FROM metrics AS m
LEFT JOIN logs AS l ON m.host = l.host AND m.ts = l.ts
ORDER BY m.ts, m.host;
+---------------------+---------------------------------------------------------+-------+-------------+------------+
| ts                  | prom_quantile_over_time(ts_range,latency,Float64(0.95)) | host  | method_name | num_errors |
+---------------------+---------------------------------------------------------+-------+-------------+------------+
| 2024-07-11 20:00:10 |                                      140.89999999999998 | host1 | GetUser     |         10 |
| 2024-07-11 20:00:10 |                                                   113.8 | host2 | GetUser     |          0 |
| 2024-07-11 20:00:15 |                                                    3560 | host1 | GetUser     |          4 |
| 2024-07-11 20:00:15 |                                                   114.2 | host2 | GetUser     |          0 |
| 2024-07-11 20:00:20 |                                                    3400 | host1 | GetUser     |          0 |
| 2024-07-11 20:00:20 |                                                     115 | host2 | GetUser     |          0 |
+---------------------+---------------------------------------------------------+-------+-------------+------------+
GreptimeDB Dashboard
GreptimeDB offers a Dashboard for data exploration and management.
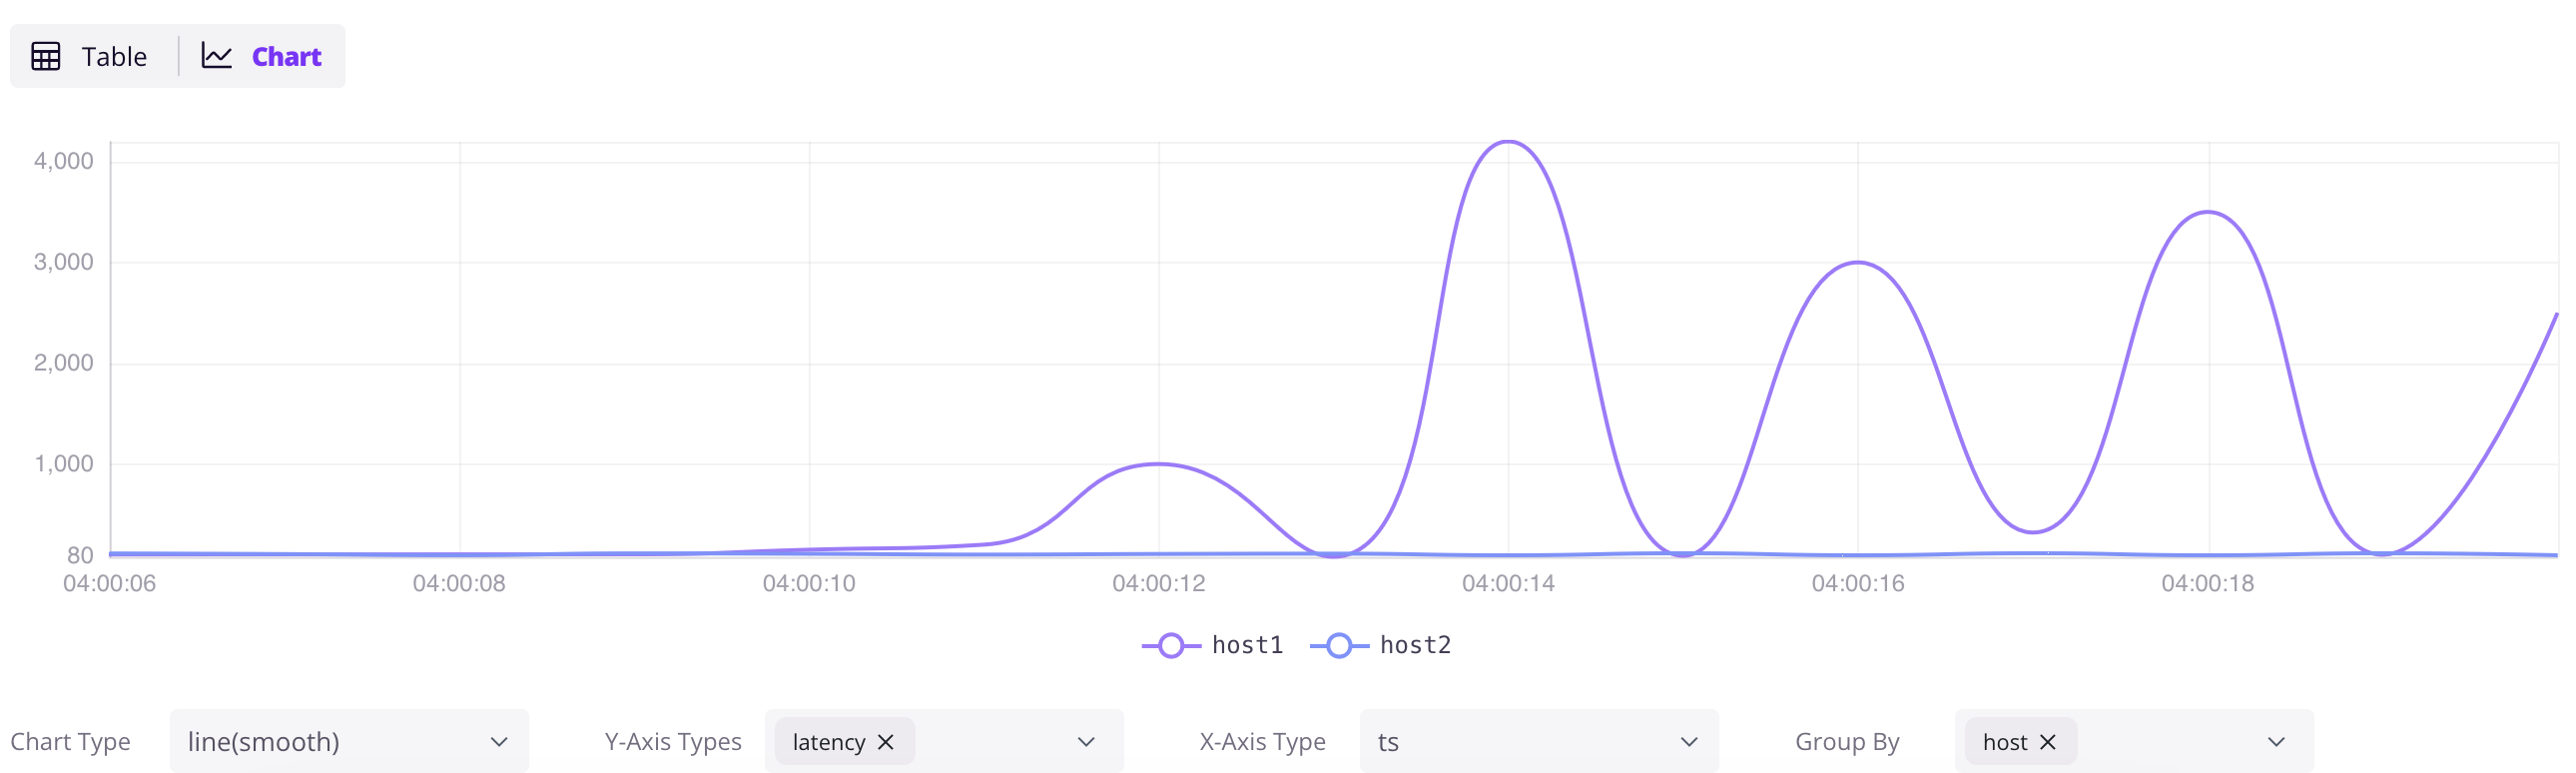
Explore data
Access the Dashboard at http://localhost:4000/dashboard. Click the + button to add a query, write SQL, and click Run All. Click the Chart button in the result panel to visualize the data.
SELECT * FROM grpc_latencies;
Ingest data by InfluxDB Line Protocol
Click the Ingest icon in the Dashboard to write data in InfluxDB Line Protocol format. For example:
grpc_metrics,host=host1,method_name=GetUser latency=100,code=0 1720728021000000000
grpc_metrics,host=host2,method_name=GetUser latency=110,code=1 1720728021000000000
Click Write to ingest the data. The grpc_metrics table is created automatically if it doesn't exist — this is GreptimeDB's schemaless capability in action.
Next steps
Connect your existing stack:
- Prometheus Remote Write — point your Prometheus at GreptimeDB
- OpenTelemetry — configure OTel Collector to send metrics, logs, and traces
- Jaeger — use GreptimeDB as Jaeger's storage backend
- Loki — send logs using Loki protocol
- Elasticsearch — send logs, traces and events using Elasticsearch
_bulkAPI - Find all ingestion methods.
Visualize and monitor:
- Grafana integration — connect Grafana with SQL or PromQL datasource
- Official Dashboard — the embedded dashboard at
http://localhost:4000/dashboard
Go deeper:
- Why GreptimeDB — architecture, cost comparison, and how GreptimeDB compares
- Observability 2.0 — wide events and the unified data model
- Demo scene — more hands-on examples
- User Guide — complete reference