GreptimeDB Dashboard
Visualization plays a crucial role in effectively utilizing time series data. To help users leverage the various features of GreptimeDB, Greptime offers a simple dashboard.
The Dashboard is embedded into GreptimeDB's binary since GreptimeDB v0.2.0. After starting GreptimeDB Standalone or GreptimeDB Cluster, the dashboard can be accessed via the HTTP endpoint http://localhost:4000/dashboard. The dashboard supports multiple query languages, including SQL queries, and PromQL queries.
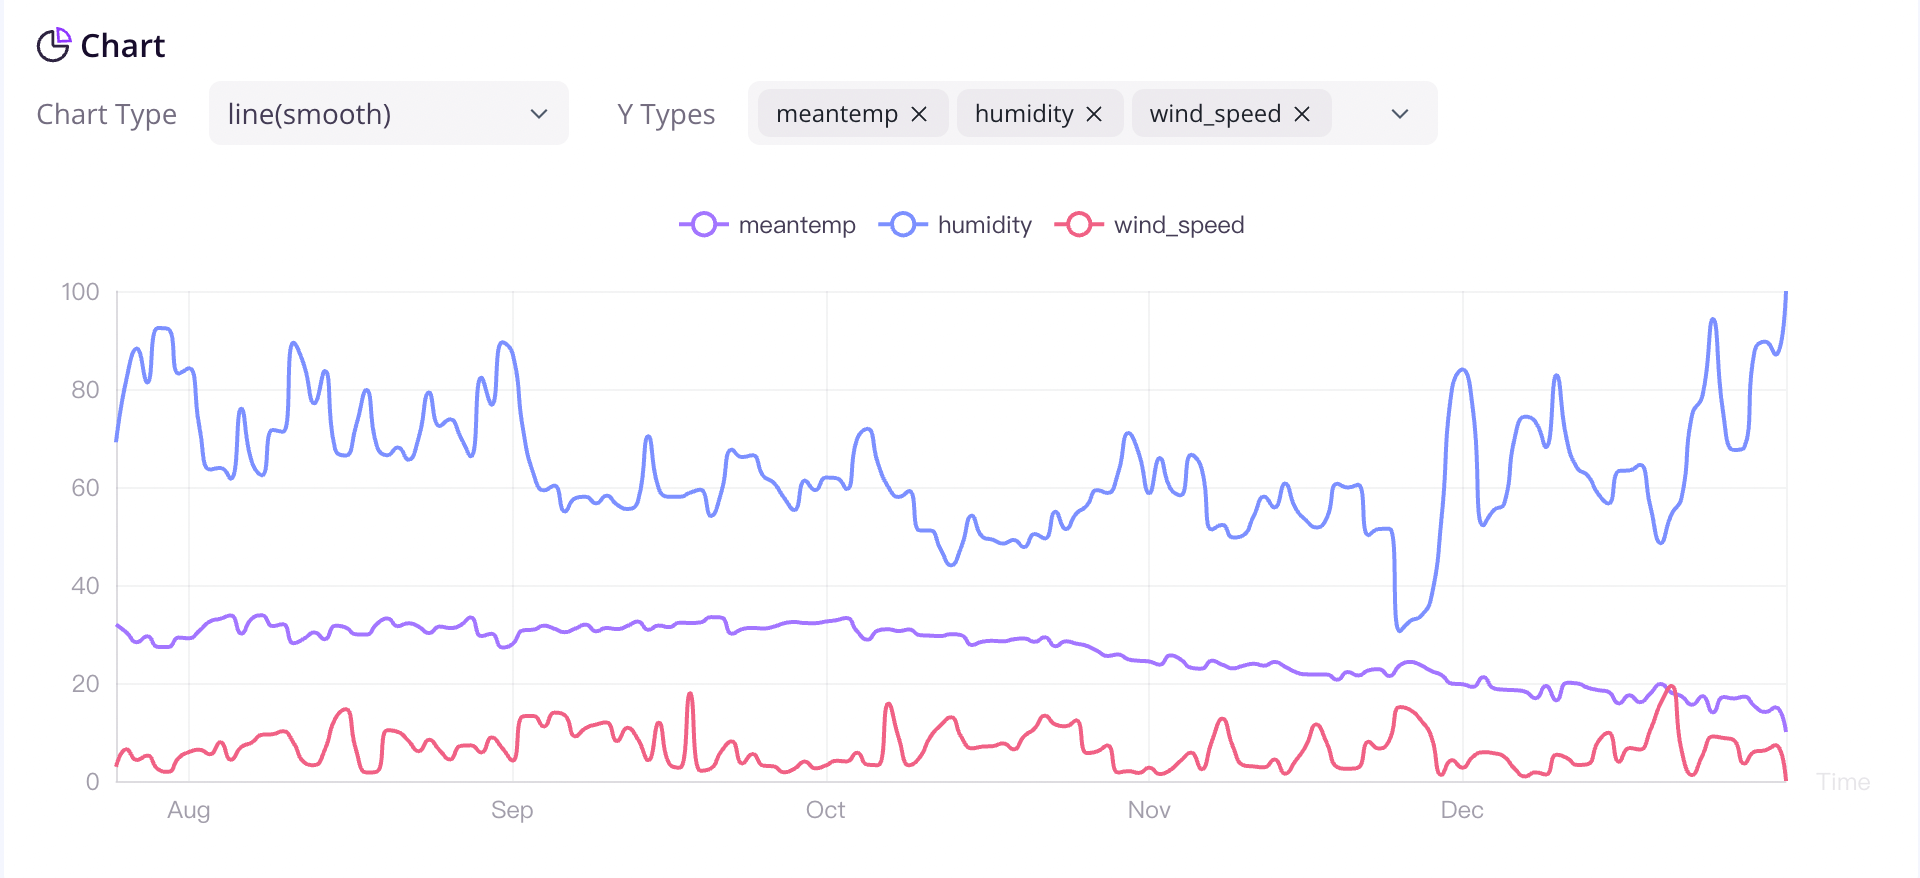
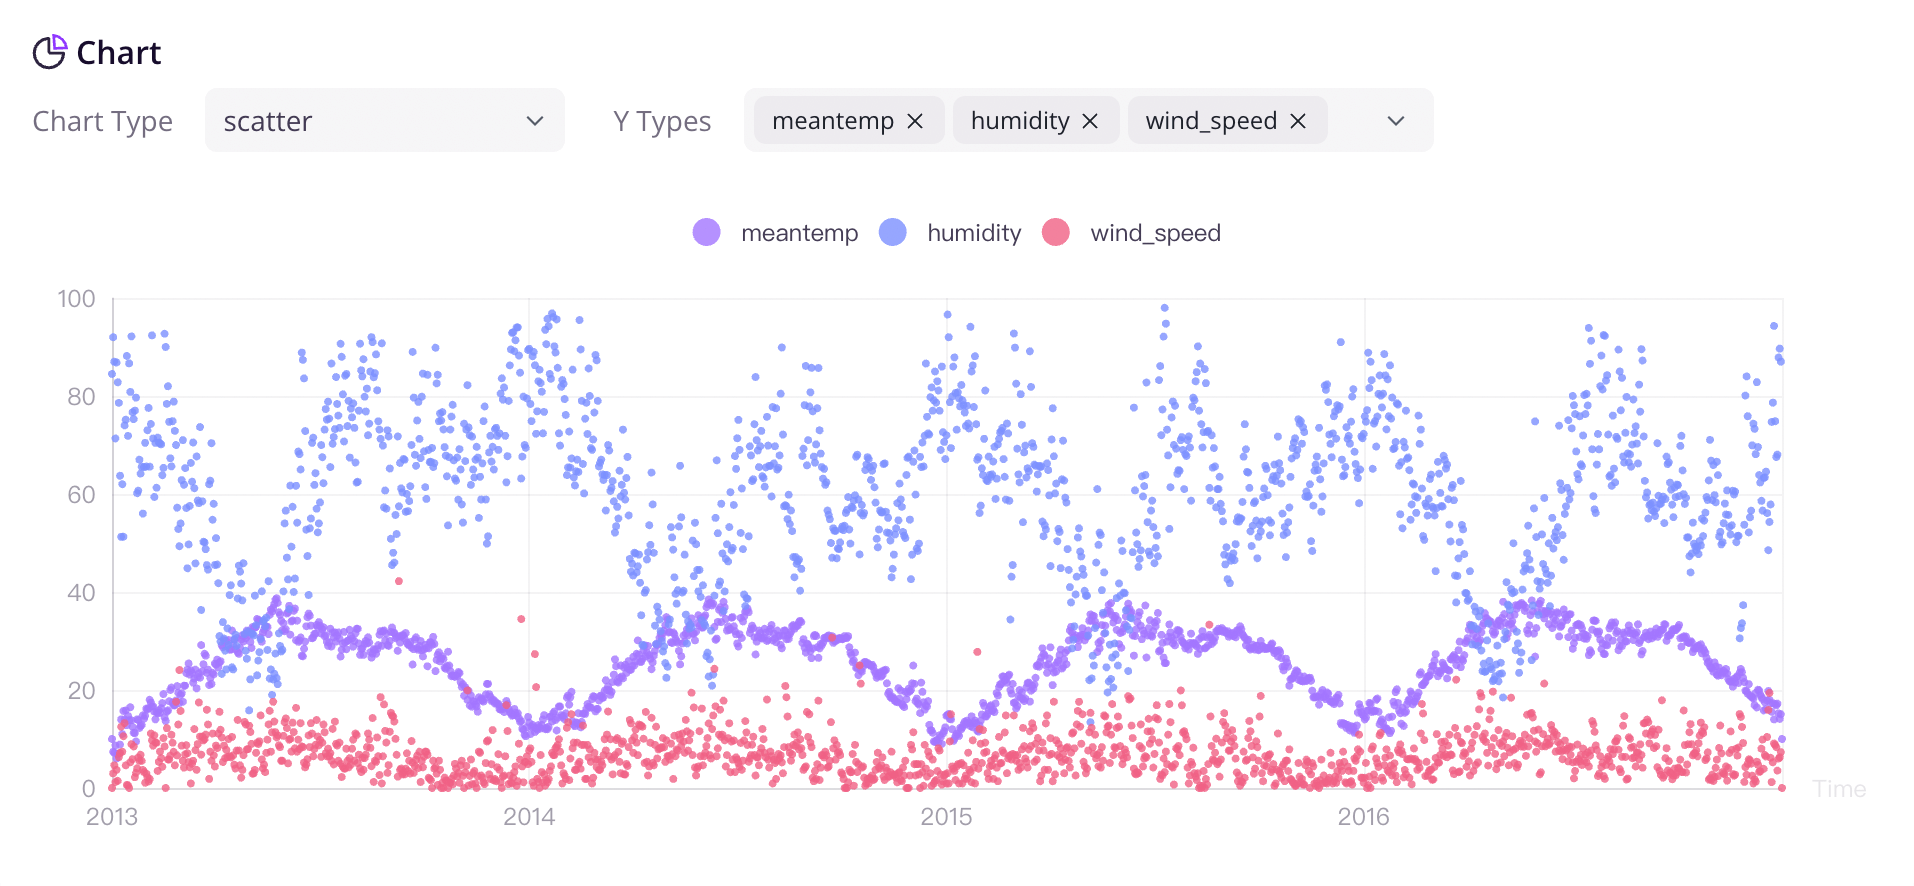
We offer various chart types to choose from based on different scenarios. The charts become more informative when you have sufficient data.
We are committed to the ongoing development and iteration of this open-source project, and we plan to expand the application of time series data in monitoring, analysis, and other relevant fields in the future.