GreptimeDB Dashboard
GreptimeDB stores metrics, logs, and traces in a single database. The Dashboard is a built-in web UI for exploring that data after installation — no extra components required. For the motivation behind unified observability storage, see Why GreptimeDB.
Access the Dashboard
The Dashboard is embedded in the GreptimeDB binary since v0.2.0. After starting GreptimeDB Standalone or GreptimeDB Cluster, open:
http://localhost:4000/dashboard
To disable the Dashboard HTTP service, set --disable-dashboard when starting the frontend. See frontend command-line options.
Explore your data
The Dashboard provides a general query entry and signal-specific views:
| View | Data scope | Description |
|---|---|---|
| Table Query | Any data | General query entry. Switch between SQL and PromQL in the editor. |
| Metrics Query | Metrics | Browse and query metrics with a PromQL-oriented UI. |
| Logs Query | Logs | Filter and search logs with a builder or code editor. |
| Traces Query | Traces | Search traces and inspect spans with a builder or code editor. |
Table Query
Table Query is the Dashboard's general query entry. You can query any data in GreptimeDB and switch between SQL and PromQL in the editor. Browse databases and tables on the left, run queries with Run Query, Explain Query, or Run All, and view results below.
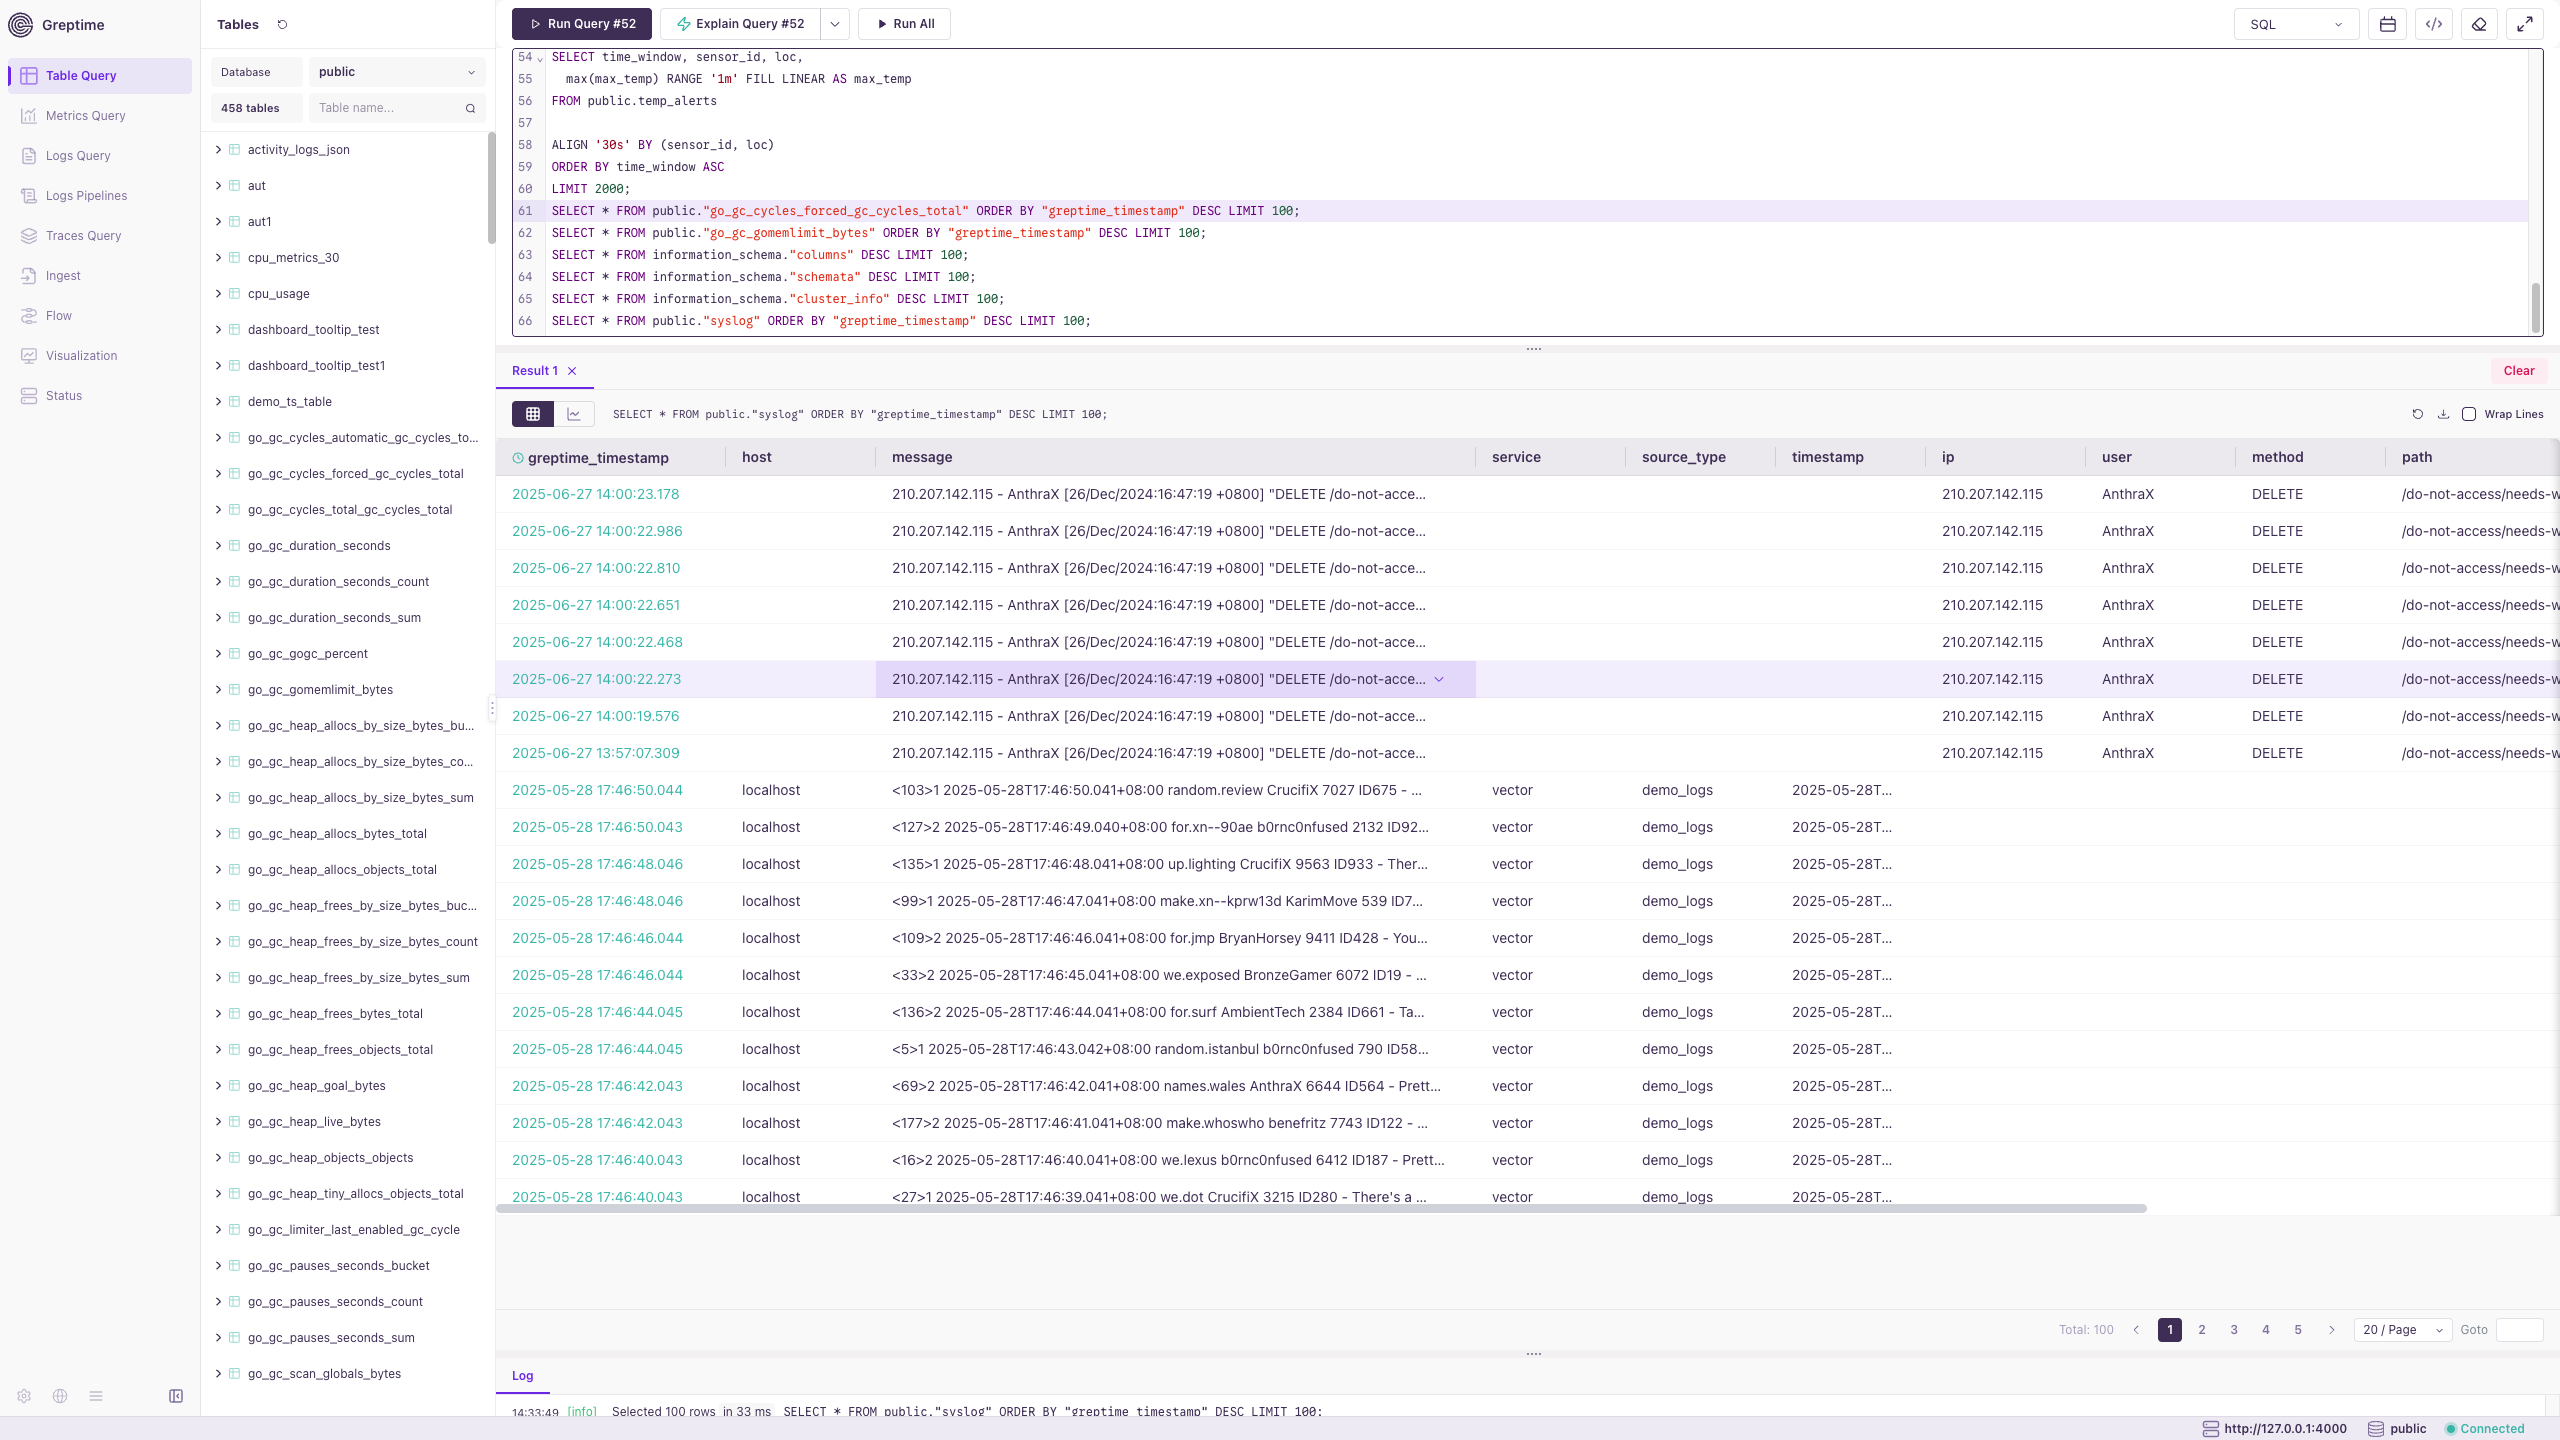
- Browse databases and tables in the left panel.
- Write multiple queries in a single editor.
- Inspect results in a table with pagination.
- Use Explain Query to visualize
EXPLAIN ANALYZEexecution plans.
See SQL and PromQL for query syntax.
Metrics Query
Metrics Query is a metrics-specific view. Browse available metrics, enter a metric name or PromQL expression, and switch between list and chart views.
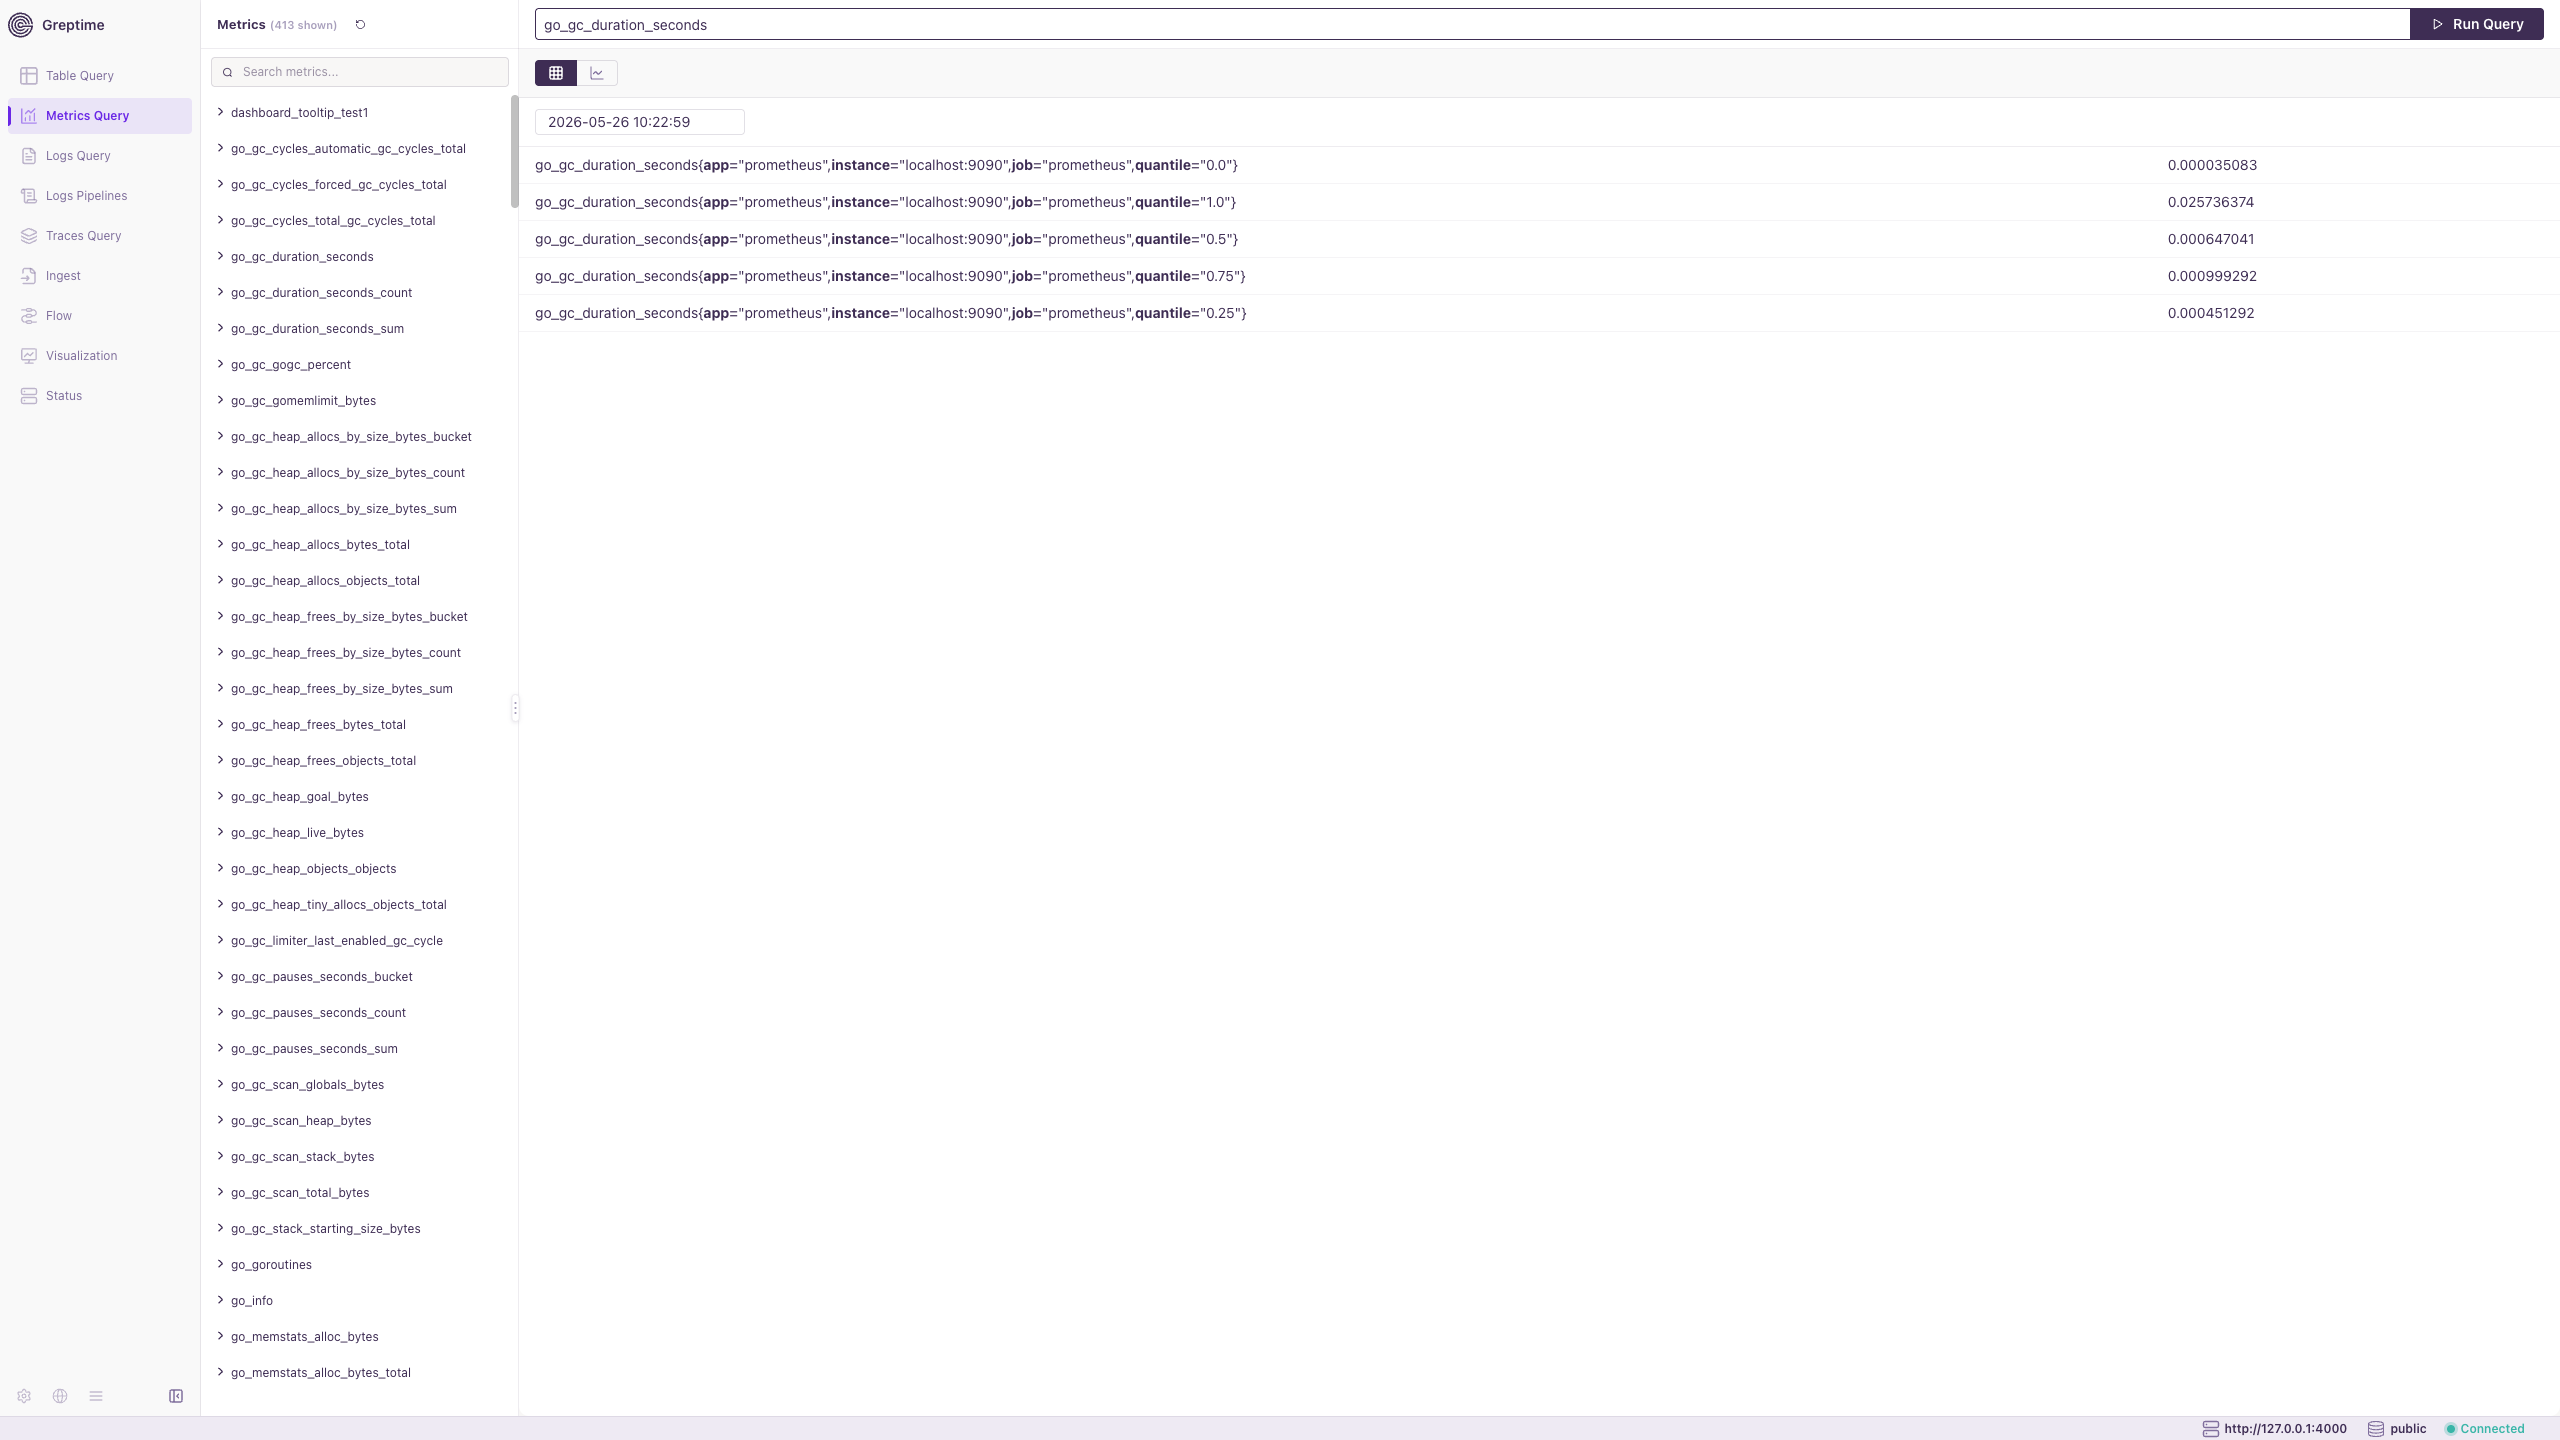
- Search and browse metrics in the left panel.
- Run queries from the editor and view label sets with values.
- Toggle between list and chart display.
See PromQL for query syntax. You can also run PromQL from Table Query.
Logs Query
Logs Query is a logs-specific view. Select a database and log table, add filters, and inspect log lines. Use Builder for point-and-click queries or Code to write queries directly.
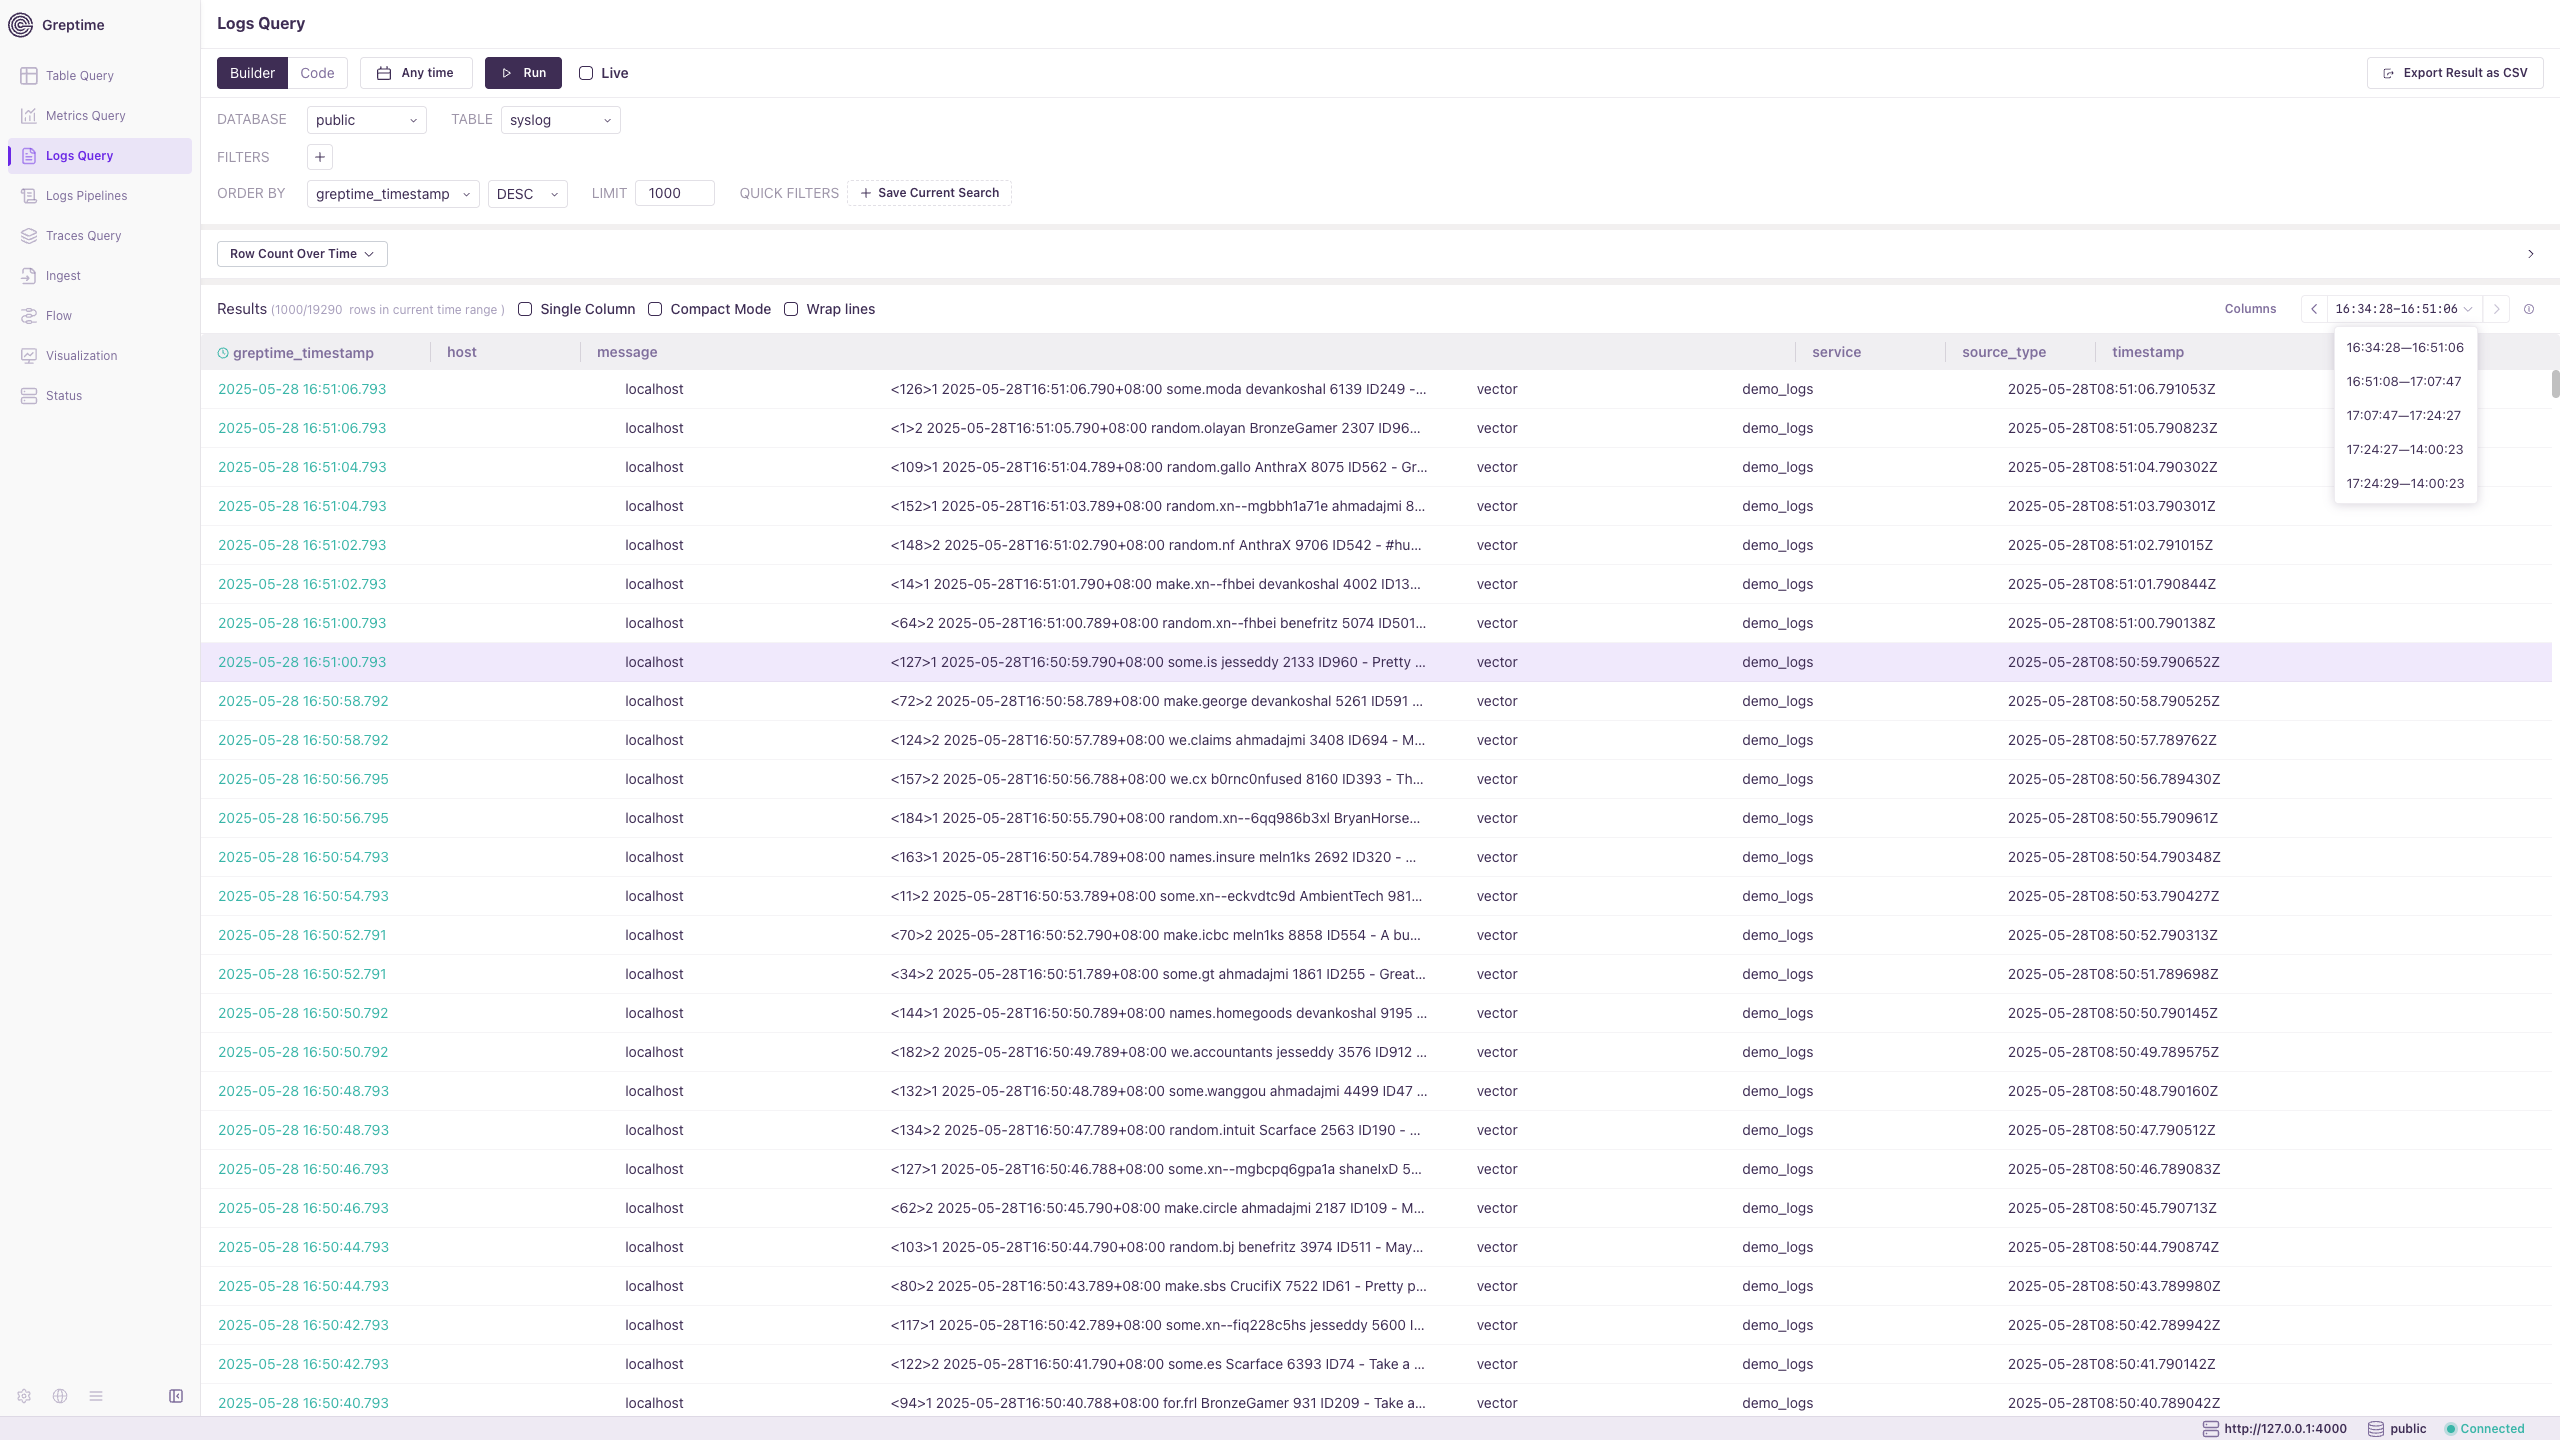
- Set time range, filters, order, and limit in the builder.
- View a row-count chart over time above the results.
- Enable Live for streaming results or export results as CSV.
See Log Query and Logs for more details.
Traces Query
Traces Query is a traces-specific view. Select a trace table, filter by trace ID or span attributes, and inspect trace records.
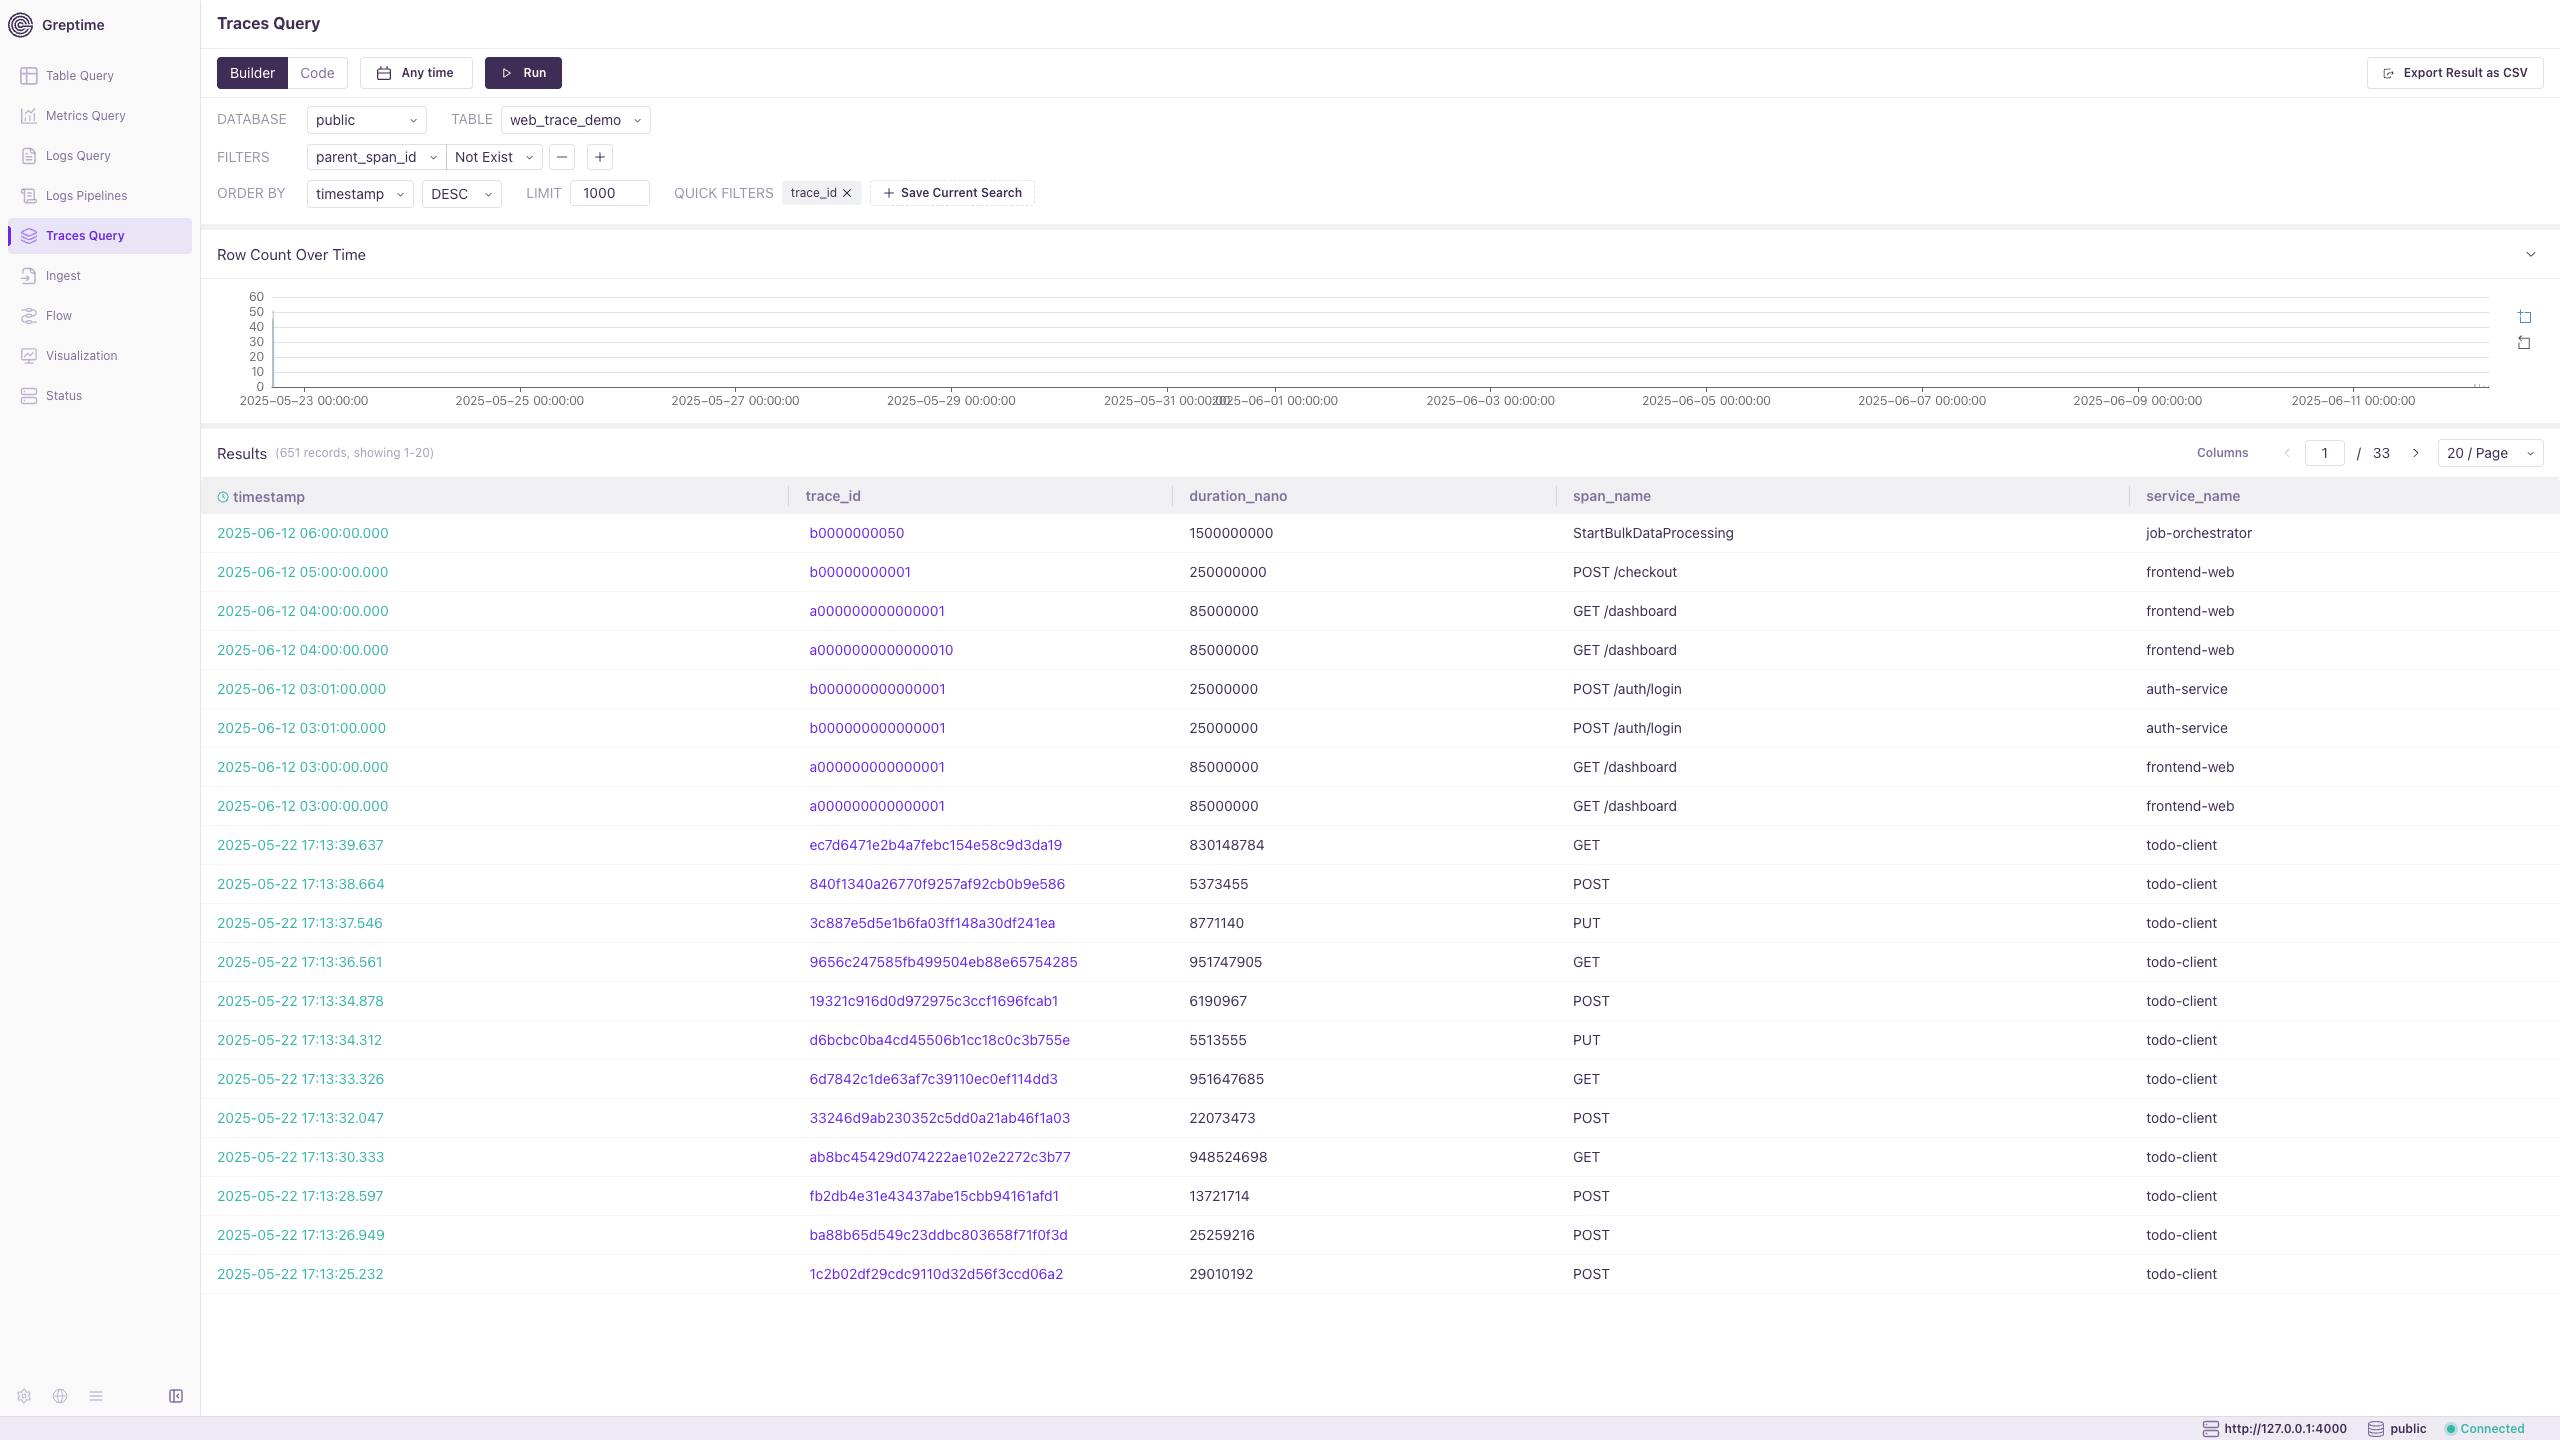
- Use Builder or Code to compose queries.
- Filter root spans (for example,
parent_span_idnot exist) or search bytrace_id.
See Traces and Jaeger for more details.
Visualization
The Dashboard embeds Perses for building observability dashboards. Click Visualization in the sidebar to create, edit, and browse dashboards — no separate Perses installation required.
GreptimeDB pre-configures two datasource plugins that connect to your local instance:
| Query type | Datasource plugin | Panel types | Use for |
|---|---|---|---|
| PromQL | PrometheusDatasource | TimeSeriesChart, GaugeChart, StatChart | Prometheus metrics, node_exporter, migrated Grafana dashboards |
| SQL time series | GreptimeDBDatasource | TimeSeriesChart, StatChart, Table | GreptimeDB tables with RANGE, ALIGN, and FILL |
| Logs | GreptimeDBDatasource | LogsTable | Log tables with SQL filters and dashboard variables |
| Traces | GreptimeDBDatasource | TraceTable, TracingGanttChart | Trace tables — trace list and per-trace Gantt view |
For example, the built-in Node Exporter dashboard uses PromQL to show CPU, memory, disk, and network panels with variables such as job and host:
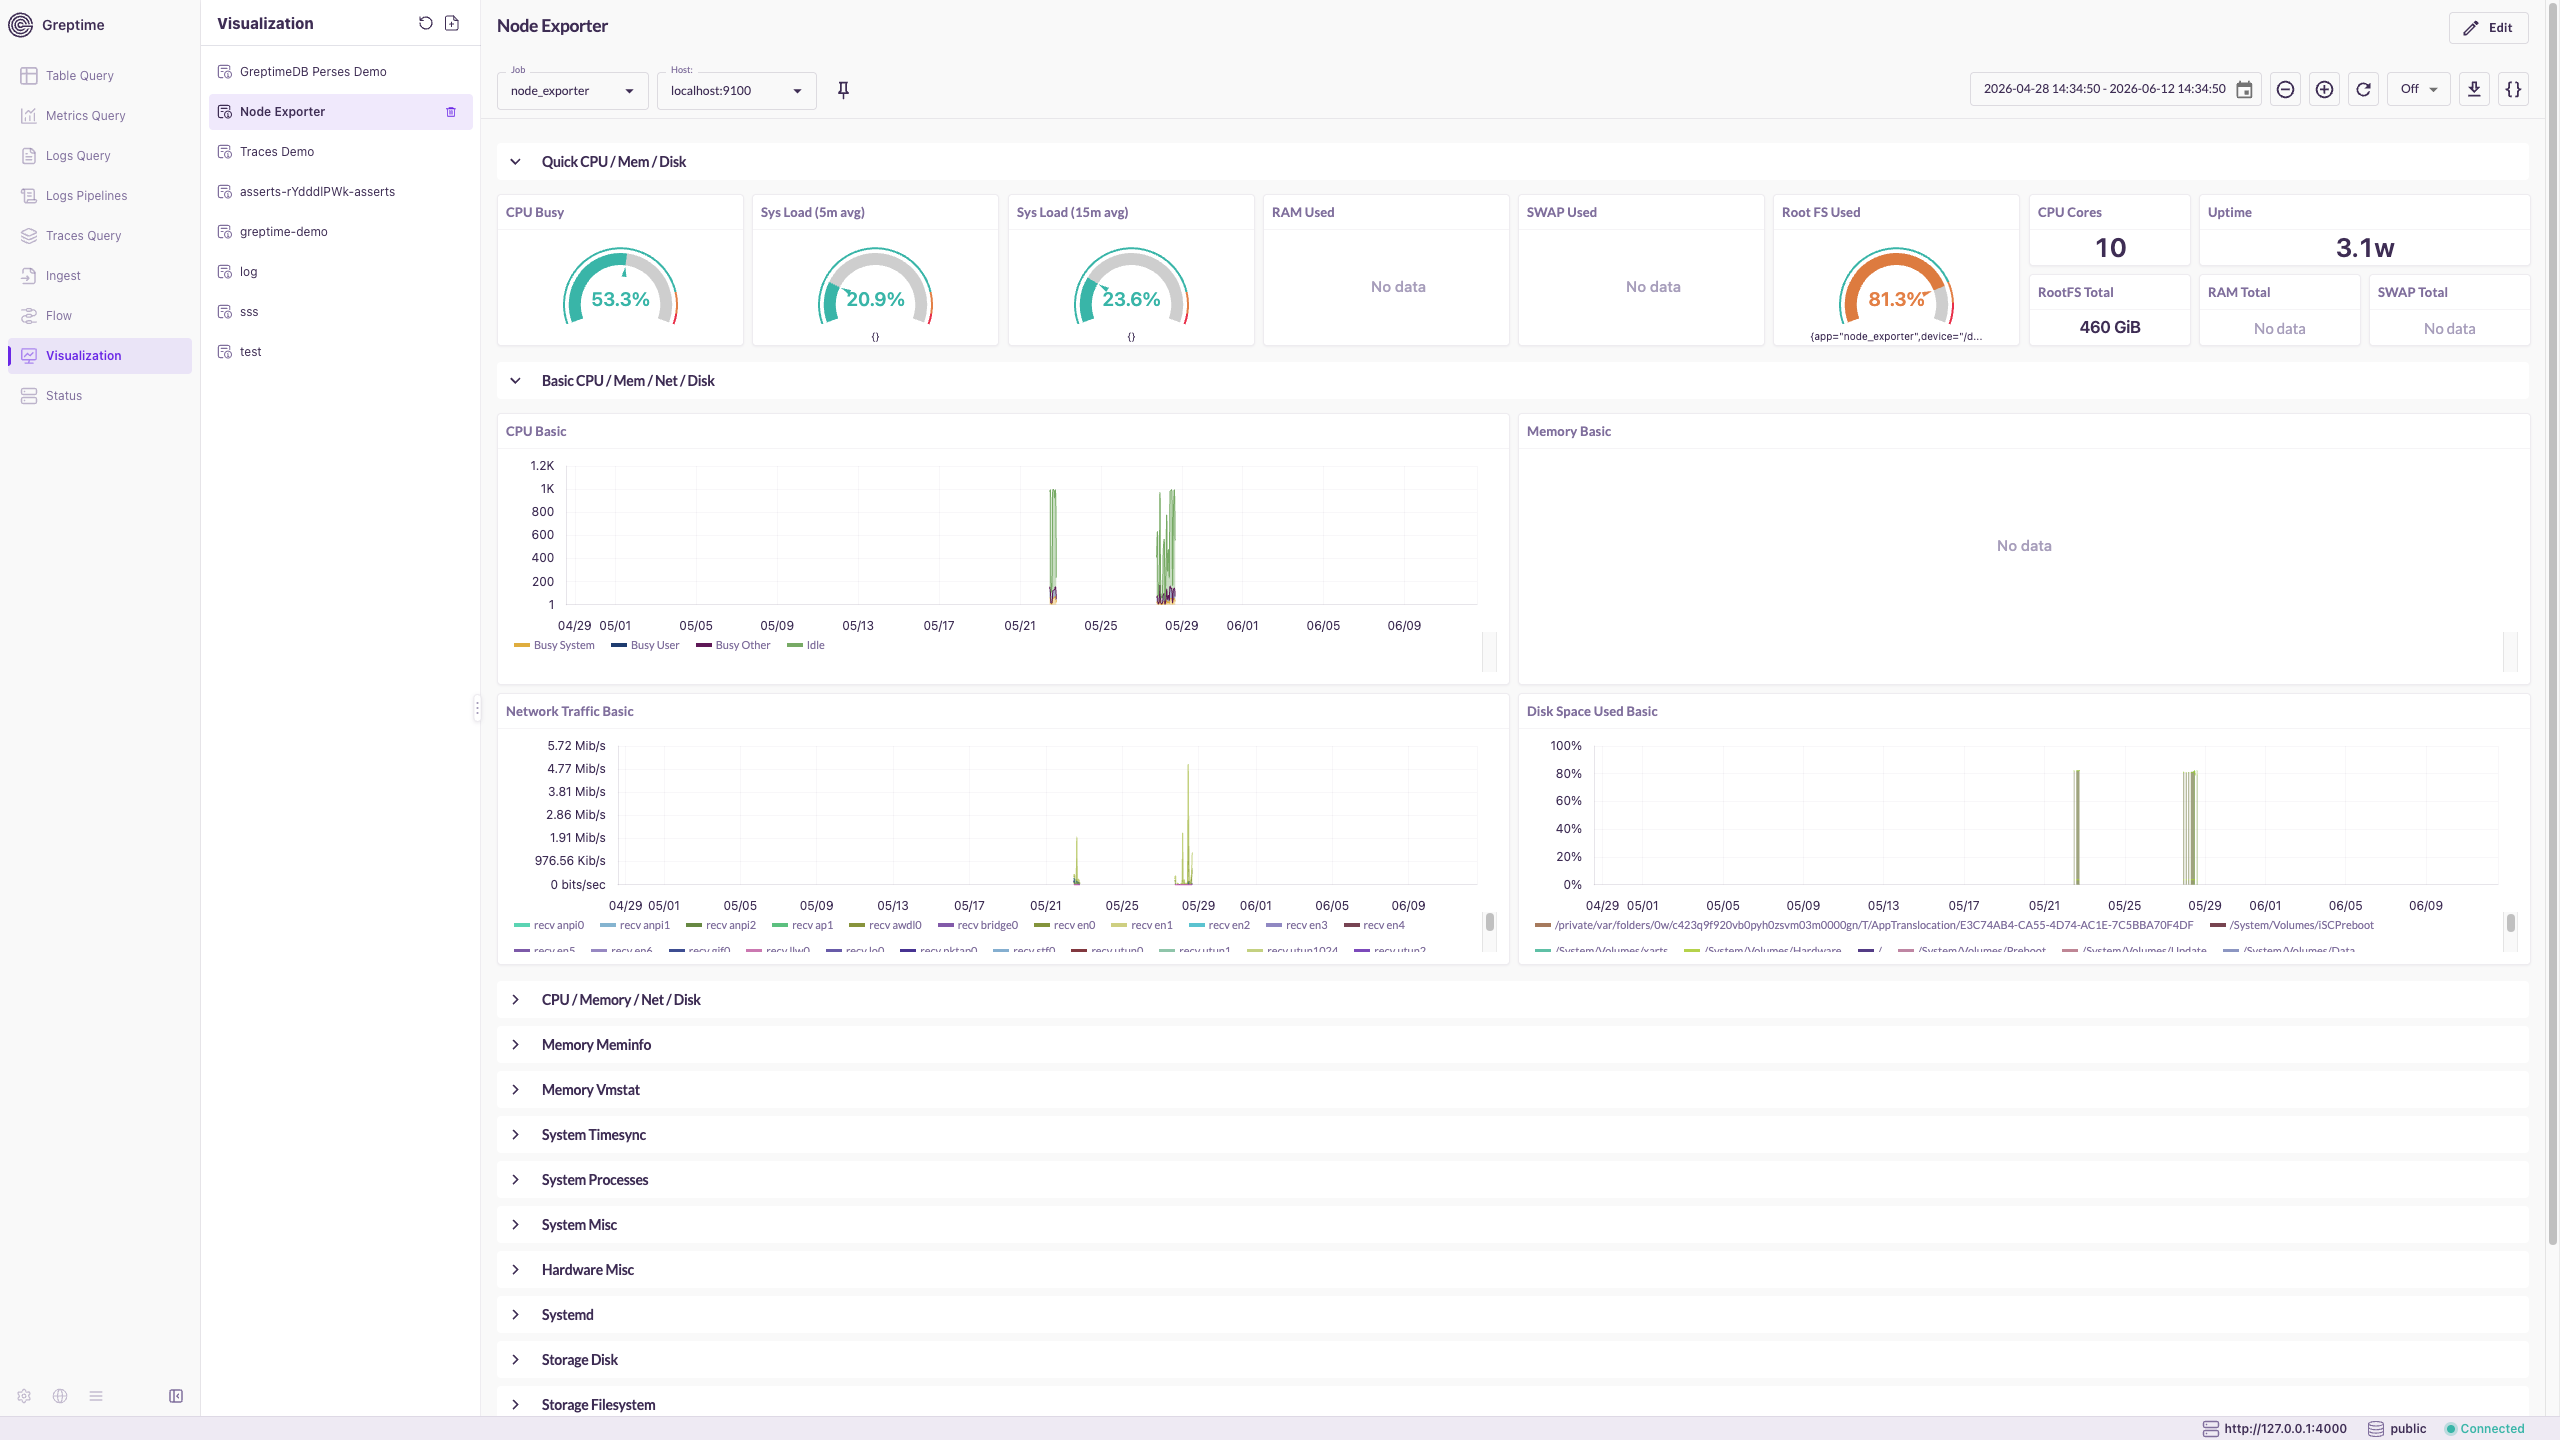
See Perses integration for datasource connection, panel configuration, and Grafana migration.
More capabilities
The Dashboard also includes:
Logs Pipelines
Create, edit, and test log pipelines in the UI. See Manage Pipelines.
Ingest
Write data manually in InfluxDB Line Protocol format.
Flow
View and manage Flow tasks for continuous computation. See Manage Flow.