Perses
Perses is a CNCF observability dashboard project. You can connect a Perses instance to GreptimeDB with two official datasource plugins:
- GreptimeDB datasource — run SQL against metrics, logs, and traces tables
- Prometheus datasource — run PromQL against GreptimeDB's Prometheus-compatible API
The GreptimeDB plugin is part of the CNCF Perses plugin repository. Together, these plugins let you build unified observability dashboards on top of GreptimeDB's single-database storage. See Why GreptimeDB for the unified data model.
GreptimeDB also embeds Perses in the built-in Dashboard (Visualization menu). Open http://localhost:4000/dashboard, click Visualization, and use the same datasource plugins described below. You can also configure GreptimeDB in a standalone Perses deployment.
Supported query types
| Query type | Datasource plugin | Query plugin | Panel types |
|---|---|---|---|
| PromQL | PrometheusDatasource | PrometheusTimeSeriesQuery | TimeSeriesChart, GaugeChart, StatChart |
| SQL time series | GreptimeDBDatasource | GreptimeDBTimeSeriesQuery | TimeSeriesChart, StatChart, Table |
| Logs | GreptimeDBDatasource | GreptimeDBLogQuery | LogsTable |
| Traces | GreptimeDBDatasource | GreptimeDBTraceQuery | TraceTable, TracingGanttChart |
Use PromQL for standard metrics dashboards. Use the GreptimeDB datasource for logs, traces, and SQL-based time series with RANGE, ALIGN, and FILL.
Prerequisites
- A running GreptimeDB instance. See GreptimeDB Standalone or GreptimeDB Cluster. Ensure the GreptimeDB HTTP API is reachable from Perses.
- A running Perses instance. Recent Perses releases ship the GreptimeDB and Prometheus datasource plugins.
Choose a datasource
| Scenario | Perses plugin | GreptimeDB endpoint |
|---|---|---|
Prometheus metrics, node_exporter, existing PromQL dashboards | PrometheusDatasource | http://<host>:4000/v1/prometheus |
Log tables, trace tables, SQL time series (RANGE, ALIGN) | GreptimeDBDatasource | http://<host>:4000 |
Use PromQL for standard metrics dashboards. Use the GreptimeDB datasource for logs, traces, and advanced SQL aggregation.
GreptimeDB datasource plugin
The GreptimeDB datasource plugin sends SQL queries to GreptimeDB over HTTP.
Connection settings
In Perses, go to Settings → Datasources → Add. Select GreptimeDB Datasource as the plugin, set Access Type to Direct access, and fill in the URL:
http://<host>:4000
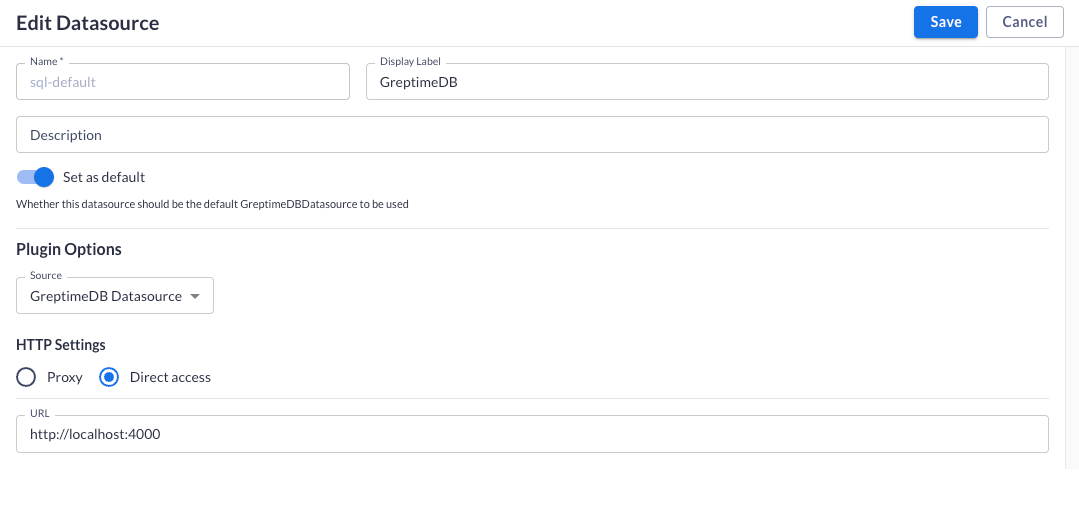
Click Save to create the datasource.
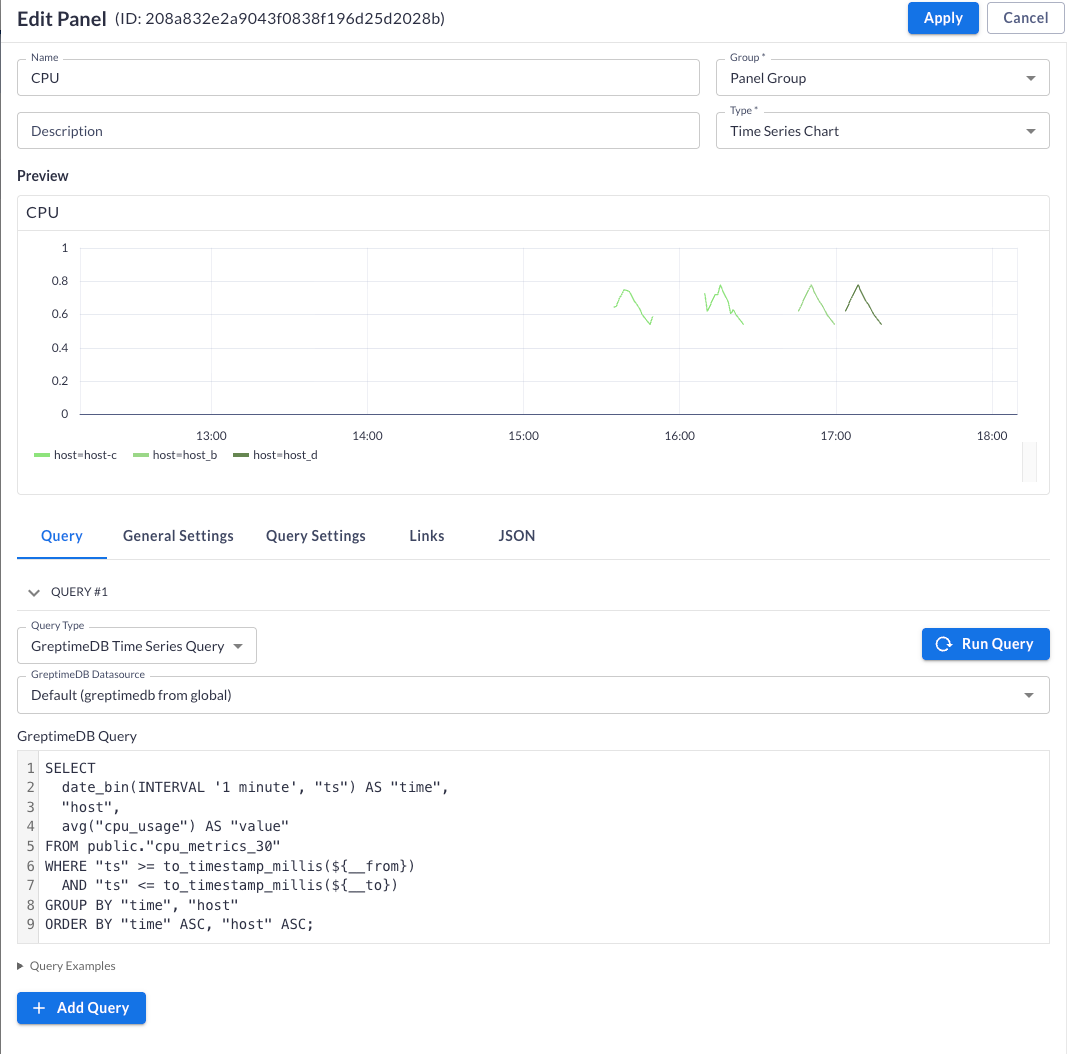
Metrics query (SQL)
Add a panel with type Time Series Chart. In the Query tab, select GreptimeDB Time Series Query and the GreptimeDB datasource.
Bind panel queries to the dashboard time range with ${__from} and ${__to}. These variables are millisecond timestamps. Use to_timestamp_millis() to match GreptimeDB timestamp columns:
SELECT
  date_bin(INTERVAL '1 minute', "ts") AS "time",
  "host",
  avg("cpu_usage") AS "value"
FROM public."cpu_metrics_30"
WHERE "ts" >= to_timestamp_millis(${__from})
  AND "ts" <= to_timestamp_millis(${__to})
GROUP BY "time", "host"
ORDER BY "time" ASC, "host" ASC;
Click Run Query to preview the chart, then Apply to save the panel.
See SQL for query syntax.
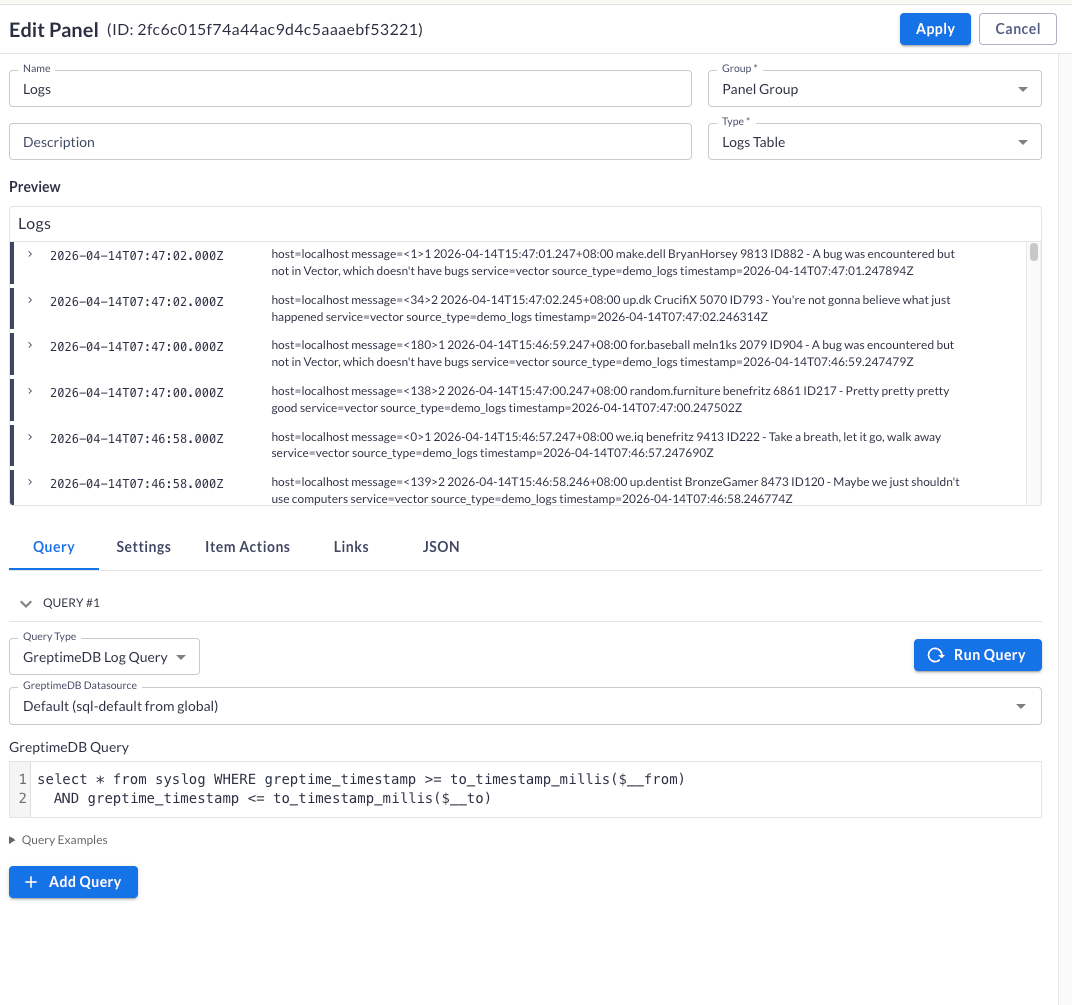
Logs query
Add a panel with type Logs Table. In the Query tab, select GreptimeDB Log Query and the GreptimeDB datasource.
Write a SQL query against your log table. Use ${__from} and ${__to} to filter by the dashboard time range:
SELECT * FROM syslog
WHERE greptime_timestamp >= to_timestamp_millis(${__from})
  AND greptime_timestamp <= to_timestamp_millis(${__to})
Click Run Query to preview the logs, then Apply to save the panel.
Traces
For trace search and Gantt views, use Traces Query in the GreptimeDB Dashboard — no extra configuration required.
Prometheus datasource plugin
The Prometheus datasource plugin queries GreptimeDB through its Prometheus-compatible HTTP API.
Connection settings
In Perses, go to Settings → Datasources → Add. Select Prometheus as the plugin, set Access Type to Direct access, and fill in the URL:
http://<host>:4000/v1/prometheus
Click Save to create the datasource.
PromQL query
Use PrometheusTimeSeriesQuery with panels such as TimeSeriesChart, GaugeChart, or StatChart.
node_cpu_seconds_total{mode="idle"}
See PromQL for query syntax.
Migrate Grafana dashboards
GreptimeDB is compatible with the Prometheus ecosystem. You can import existing Grafana dashboards into Perses with the Perses migration tool. After migration, map PromQL panels to the Prometheus datasource pointing at GreptimeDB. Variables, gauges, and time series panels from dashboards such as Node Exporter should work without changes to the queries.
Next steps
- Grafana integration — connect Grafana to GreptimeDB
- GreptimeDB Dashboard — built-in query UI with embedded Perses
- Why GreptimeDB — unified observability storage