Manage ETCD
The GreptimeDB cluster requires an etcd cluster for metadata storage by default. Let's install an etcd cluster using Bitnami's etcd Helm chart.
Prerequisites
- Kubernetes >= v1.23
- kubectl >= v1.18.0
- Helm >= v3.0.0
Install
Save the following configuration as a file etcd.yaml:
replicaCount: 3

auth:
  rbac:
    create: false
  token:
    enabled: false

persistence:
  storageClass: null
  size: 8Gi

resources:
  limits:
    cpu: '2'
    memory: 8Gi
  requests:
    cpu: '2'
    memory: 8Gi

autoCompactionMode: "periodic"
autoCompactionRetention: "1h"

extraEnvVars:
  - name: ETCD_QUOTA_BACKEND_BYTES
    value: "8589934592"
  - name: ETCD_ELECTION_TIMEOUT
    value: "2000"
  - name: ETCD_SNAPSHOT_COUNT
    value: "10000"
Install etcd cluster:
helm upgrade --install etcd \
  oci://registry-1.docker.io/bitnamicharts/etcd \
  --create-namespace \
  -n etcd-cluster \
  --values etcd.yaml
Wait for etcd cluster to be running:
kubectl get pod -n etcd-cluster
Expected Output
NAME     READY   STATUS    RESTARTS   AGE
etcd-0   1/1     Running   0          64s
etcd-1   1/1     Running   0          65s
etcd-2   1/1     Running   0          72s
When the etcd cluster is running, use the following command to check the health status of etcd cluster:
kubectl -n etcd-cluster \
  exec etcd-0 -- etcdctl \
  --endpoints etcd-0.etcd-headless.etcd-cluster:2379,etcd-1.etcd-headless.etcd-cluster:2379,etcd-2.etcd-headless.etcd-cluster:2379 \
  endpoint status -w table
Expected Output
+----------------------------------------+------------------+---------+---------+-----------+------------+-----------+------------+--------------------+--------+
|                ENDPOINT                |        ID        | VERSION | DB SIZE | IS LEADER | IS LEARNER | RAFT TERM | RAFT INDEX | RAFT APPLIED INDEX | ERRORS |
+----------------------------------------+------------------+---------+---------+-----------+------------+-----------+------------+--------------------+--------+
| etcd-0.etcd-headless.etcd-cluster:2379 | 680910587385ae31 |  3.5.15 |   20 kB |     false |      false |         4 |      73991 |              73991 |        |
| etcd-1.etcd-headless.etcd-cluster:2379 | d6980d56f5e3d817 |  3.5.15 |   20 kB |     false |      false |         4 |      73991 |              73991 |        |
| etcd-2.etcd-headless.etcd-cluster:2379 | 12664fc67659db0a |  3.5.15 |   20 kB |      true |      false |         4 |      73991 |              73991 |        |
+----------------------------------------+------------------+---------+---------+-----------+------------+-----------+------------+--------------------+--------+
Backup
In the bitnami etcd chart, a shared storage volume Network File System (NFS) is used to store etcd backup data. By using CronJob in Kubernetes to perform etcd snapshot backups and mount NFS PersistentVolumeClaim (PVC), snapshots can be transferred to NFS.
Add the following configuration and name it etcd-backup.yaml file, Note that you need to modify existingClaim to your NFS PVC name:
replicaCount: 3

auth:
  rbac:
    create: false
  token:
    enabled: false

persistence:
  storageClass: null
  size: 8Gi

resources:
  limits:
    cpu: '2'
    memory: 8Gi
  requests:
    cpu: '2'
    memory: 8Gi

autoCompactionMode: "periodic"
autoCompactionRetention: "1h"

extraEnvVars:
  - name: ETCD_QUOTA_BACKEND_BYTES
    value: "8589934592"
  - name: ETCD_ELECTION_TIMEOUT
    value: "2000"
  - name: ETCD_SNAPSHOT_COUNT
    value: "10000"

# Backup settings
disasterRecovery:
  enabled: true
  cronjob:
    schedule: "*/30 * * * *"
    historyLimit: 2
    snapshotHistoryLimit: 2
  pvc:
    existingClaim: "${YOUR_NFS_PVC_NAME_HERE}"
Redeploy etcd cluster:
helm upgrade --install etcd \
  oci://registry-1.docker.io/bitnamicharts/etcd \
  --create-namespace \
  -n etcd-cluster \
  --values etcd-backup.yaml
You can see the etcd backup scheduled task:
kubectl get cronjob -n etcd-cluster
Expected Output
NAME               SCHEDULE      TIMEZONE   SUSPEND   ACTIVE   LAST SCHEDULE   AGE
etcd-snapshotter   */30 * * * *   <none>    False     0        <none>          36s
kubectl get pod -n etcd-cluster
Expected Output
NAME                              READY   STATUS      RESTARTS   AGE
etcd-0                            1/1     Running     0          35m
etcd-1                            1/1     Running     0          36m
etcd-2                            0/1     Running     0          6m28s
etcd-snapshotter-28936038-tsck8   0/1     Completed   0          4m49s
kubectl logs etcd-snapshotter-28936038-tsck8 -n etcd-cluster
Expected Output
etcd-0.etcd-headless.etcd-cluster.svc.cluster.local:2379 is healthy: successfully committed proposal: took = 2.698457ms
etcd 11:18:07.47 INFO  ==> Snapshotting the keyspace
{"level":"info","ts":"2025-01-06T11:18:07.579095Z","caller":"snapshot/v3_snapshot.go:65","msg":"created temporary db file","path":"/snapshots/db-2025-01-06_11-18.part"}
{"level":"info","ts":"2025-01-06T11:18:07.580335Z","logger":"client","caller":"[email protected]/maintenance.go:212","msg":"opened snapshot stream; downloading"}
{"level":"info","ts":"2025-01-06T11:18:07.580359Z","caller":"snapshot/v3_snapshot.go:73","msg":"fetching snapshot","endpoint":"etcd-0.etcd-headless.etcd-cluster.svc.cluster.local:2379"}
{"level":"info","ts":"2025-01-06T11:18:07.582124Z","logger":"client","caller":"[email protected]/maintenance.go:220","msg":"completed snapshot read; closing"}
{"level":"info","ts":"2025-01-06T11:18:07.582688Z","caller":"snapshot/v3_snapshot.go:88","msg":"fetched snapshot","endpoint":"etcd-0.etcd-headless.etcd-cluster.svc.cluster.local:2379","size":"20 kB","took":"now"}
{"level":"info","ts":"2025-01-06T11:18:07.583008Z","caller":"snapshot/v3_snapshot.go:97","msg":"saved","path":"/snapshots/db-2025-01-06_11-18"}
Snapshot saved at /snapshots/db-2025-01-06_11-18
Next, you can see the etcd backup snapshot in the NFS server:
ls ${NFS_SERVER_DIRECTORY}
Expected Output
db-2025-01-06_11-18 db-2025-01-06_11-20 db-2025-01-06_11-22
Restore
When you encounter etcd data loss or corruption, such as critical information stored in etcd being accidentally deleted, or catastrophic cluster failure that prevents recovery, you need to perform an etcd restore. Additionally, restoring etcd can also be useful for development and testing purposes.
Before recovery, you need to stop writing data to the etcd cluster (stop GreptimeDB Metasrv writing) and create the latest snapshot file use for recovery.
Add the following configuration file and name it etcd-restore.yaml. Note that existingClaim is the name of your NFS PVC, and snapshotFilename is change to the etcd snapshot file name:
replicaCount: 3

auth:
  rbac:
    create: false
  token:
    enabled: false

persistence:
  storageClass: null
  size: 8Gi

resources:
  limits:
    cpu: '2'
    memory: 8Gi
  requests:
    cpu: '2'
    memory: 8Gi

autoCompactionMode: "periodic"
autoCompactionRetention: "1h"

extraEnvVars:
  - name: ETCD_QUOTA_BACKEND_BYTES
    value: "8589934592"
  - name: ETCD_ELECTION_TIMEOUT
    value: "2000"
  - name: ETCD_SNAPSHOT_COUNT
    value: "10000"

# Restore settings
startFromSnapshot:
  enabled: true
  existingClaim: "${YOUR_NFS_PVC_NAME_HERE}"
  snapshotFilename: "${YOUR_ETCD_SNAPSHOT_FILE_NAME}"
Deploy etcd recover cluster:
helm upgrade --install etcd-recover \
  oci://registry-1.docker.io/bitnamicharts/etcd \
  --create-namespace \
  -n etcd-cluster \
  --values etcd-restore.yaml
After waiting for the etcd recover cluster to be Running:
kubectl get pod -n etcd-cluster -l app.kubernetes.io/instance=etcd-recover
Expected Output
NAME             READY   STATUS    RESTARTS   AGE
etcd-recover-0   1/1     Running   0          91s
etcd-recover-1   1/1     Running   0          91s
etcd-recover-2   1/1     Running   0          91s
Next, change Metasrv etcdEndpoints to the new etcd recover cluster, in this example is "etcd-recover.etcd-cluster.svc.cluster.local:2379":
apiVersion: greptime.io/v1alpha1
kind: GreptimeDBCluster
metadata:
  name: greptimedb
spec:
  # Other configuration here
  meta:
    etcdEndpoints:
      - "etcd-recover.etcd-cluster.svc.cluster.local:2379"
Restart GreptimeDB Metasrv to complete etcd restore.
Monitoring
- Prometheus Operator installed (e.g. via kube-prometheus-stack).
- podmonitor CRD installed (automatically installed with Prometheus Operator).
Add the following to your etcd-monitoring.yaml to enable monitoring:
replicaCount: 3

auth:
  rbac:
    create: false
  token:
    enabled: false

persistence:
  storageClass: null
  size: 8Gi

resources:
  limits:
    cpu: '2'
    memory: 8Gi
  requests:
    cpu: '2'
    memory: 8Gi

autoCompactionMode: "periodic"
autoCompactionRetention: "1h"

extraEnvVars:
  - name: ETCD_QUOTA_BACKEND_BYTES
    value: "8589934592"
  - name: ETCD_ELECTION_TIMEOUT
    value: "2000"
  - name: ETCD_SNAPSHOT_COUNT
    value: "10000"

# Monitoring settings
metrics:
  enabled: true
  podMonitor:
    enabled: true
    namespace: etcd-cluster
    interval: 10s
    scrapeTimeout: 10s
    additionalLabels:
      release: prometheus
Deploy etcd with Monitoring:
helm upgrade --install etcd \
  oci://registry-1.docker.io/bitnamicharts/etcd \
  --create-namespace \
  -n etcd-cluster \
  --values etcd-monitoring.yaml
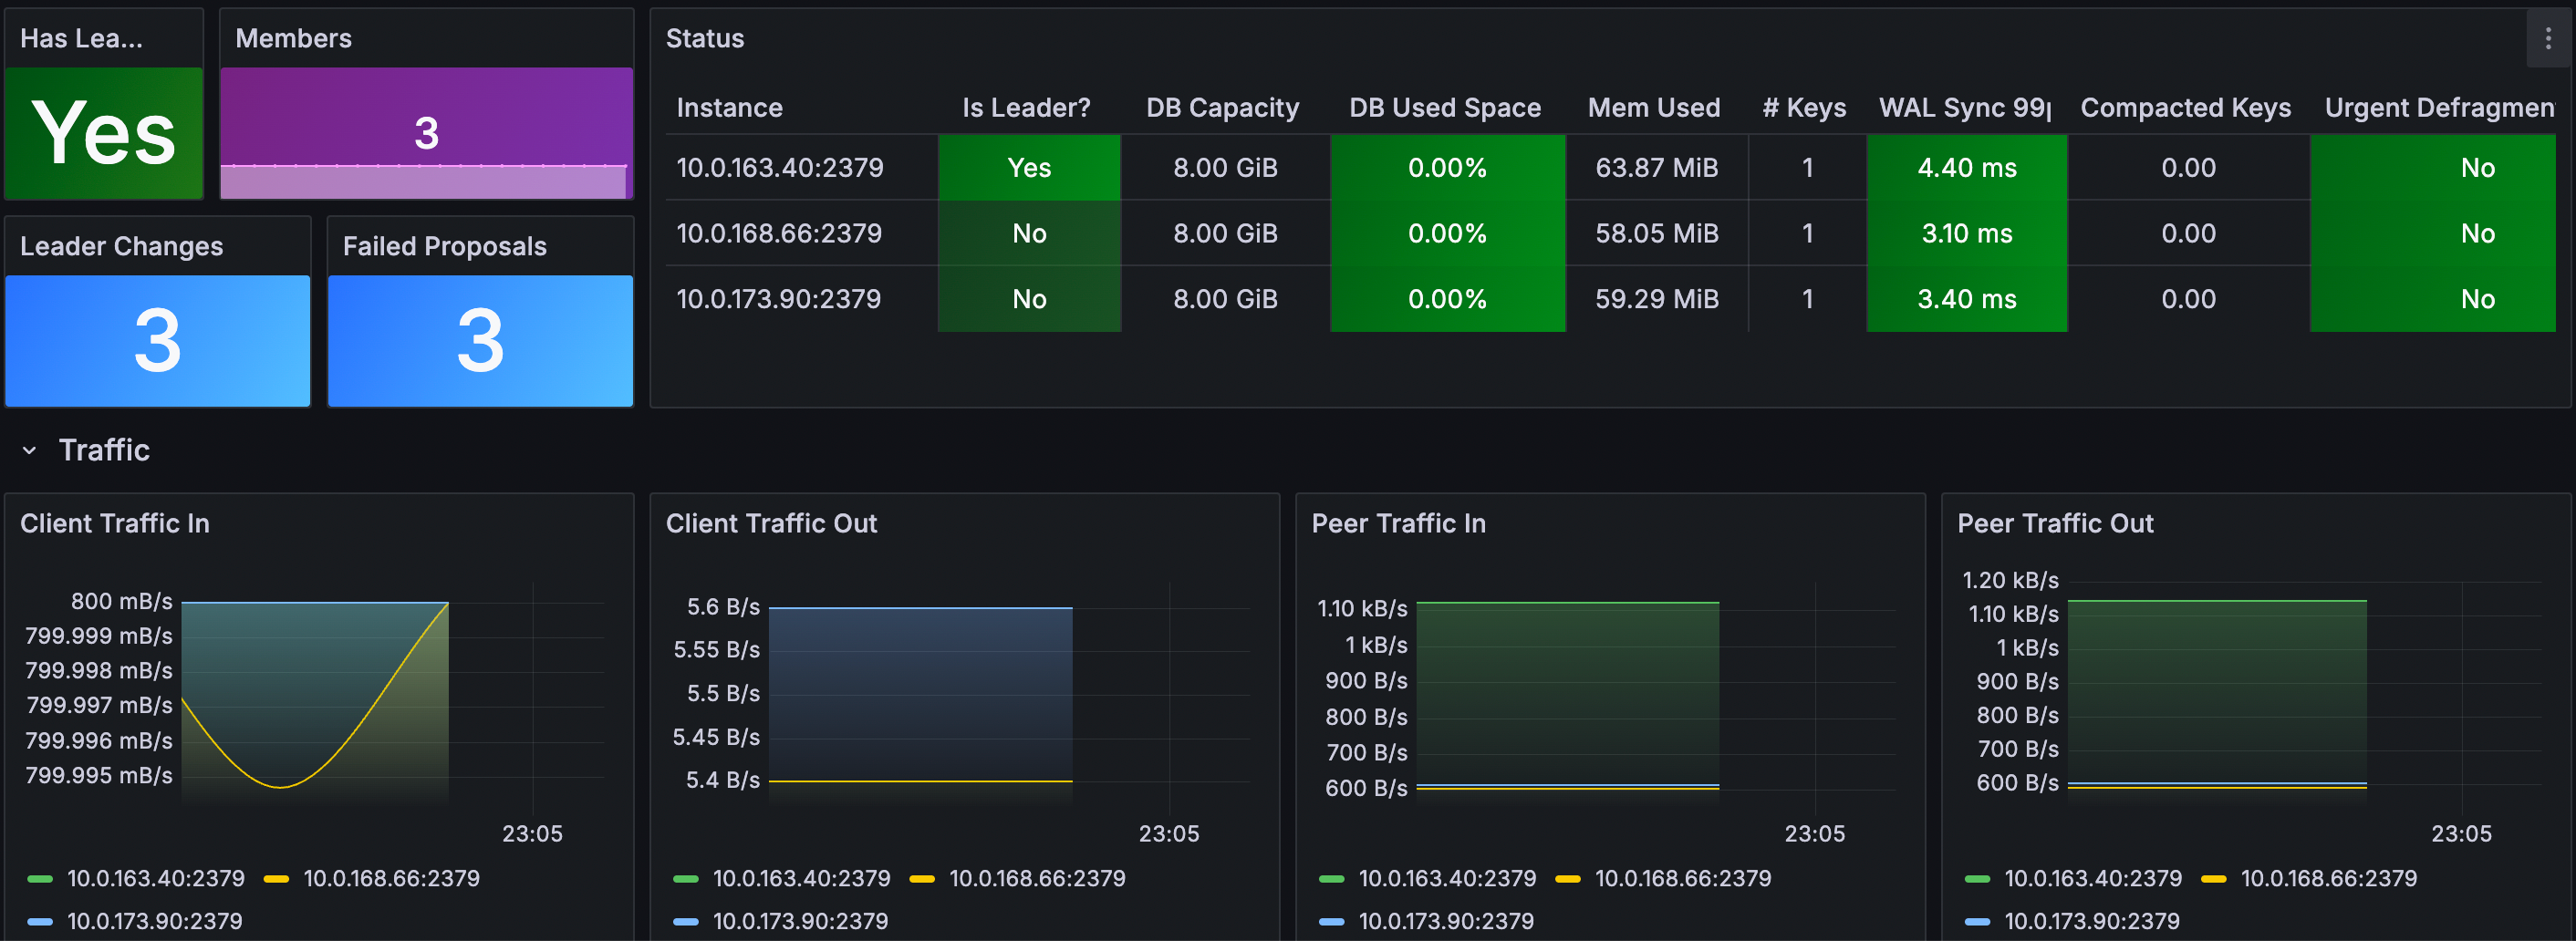
Grafana dashboard
Use the ETCD Cluster Overview dashboard (ID: 15308) for monitoring key metrics.
- Log in your Grafana.
- Navigate to Dashboards -> New -> Import.
- Enter Dashboard ID: 15308, select the data source and load.
⚠️ Defrag - Critical Warning
Defragmentation is a HIGH-RISK operation that can severely impact your ETCD cluster and dependent systems (like GreptimeDB):
- Blocks ALL read/write operations during execution (cluster becomes unavailable).
- High I/O usage may cause timeouts in client applications.
- May trigger leader elections if defrag takes too long.
- Can cause OOM kills if not properly resourced.
- May corrupt data if interrupted mid-process.
ETCD uses a multi-version concurrency control (MVCC) mechanism that stores multiple versions of KV. Over time, as data is updated and deleted, the backend database can become fragmented, leading to increased storage usage and reduced performance. Defragmentation is the process of compacting this storage to reclaim space and improve performance.
Add the following defrag-related configuration to etcd-defrag.yaml file:
replicaCount: 3

auth:
  rbac:
    create: false
  token:
    enabled: false

persistence:
  storageClass: null
  size: 8Gi

resources:
  limits:
    cpu: '2'
    memory: 8Gi
  requests:
    cpu: '2'
    memory: 8Gi

autoCompactionMode: "periodic"
autoCompactionRetention: "1h"

extraEnvVars:
  - name: ETCD_QUOTA_BACKEND_BYTES
    value: "8589934592"
  - name: ETCD_ELECTION_TIMEOUT
    value: "2000"
  - name: ETCD_SNAPSHOT_COUNT
    value: "10000"

# Defragmentation settings
defrag:
  enabled: true
  cronjob:
    schedule: "0 3 * * *"  # Daily at 3:00 AM
    suspend: false
    successfulJobsHistoryLimit: 1
    failedJobsHistoryLimit: 1
Deploying with Defrag Configuration:
helm upgrade --install etcd \
  oci://registry-1.docker.io/bitnamicharts/etcd \
  --create-namespace \
  -n etcd-cluster \
  --values etcd-defrag.yaml
You can see the etcd defrag scheduled task:
kubectl get cronjob -n etcd-cluster
Expected Output
NAME          SCHEDULE      TIMEZONE   SUSPEND   ACTIVE   LAST SCHEDULE   AGE
etcd-defrag   0 3 * * *     <none>     False     0        <none>          34s
kubectl get pod -n etcd-cluster
Expected Output
NAME                         READY   STATUS      RESTARTS   AGE
etcd-0                       1/1     Running     0          4m30s
etcd-1                       1/1     Running     0          4m29s
etcd-2                       1/1     Running     0          4m29s
etcd-defrag-29128518-sstbf   0/1     Completed   0          90s
kubectl logs etcd-defrag-29128518-sstbf -n etcd-cluster
Expected Output
Finished defragmenting etcd member[http://etcd-0.etcd-headless.etcd-cluster.svc.cluster.local:2379]
Finished defragmenting etcd member[http://etcd-1.etcd-headless.etcd-cluster.svc.cluster.local:2379]
Finished defragmenting etcd member[http://etcd-2.etcd-headless.etcd-cluster.svc.cluster.local:2379]