Prometheus
GreptimeDB can serve as a long-term storage solution for Prometheus, providing a seamless integration experience.
Remote write configuration
Prometheus configuration file
To configure Prometheus with GreptimeDB,
update your Prometheus configuration file (prometheus.yml) as follows:
remote_write:
- url: http://localhost:4000/v1/prometheus/write?db=public
# Uncomment and set credentials if authentication is enabled
#  basic_auth:
#    username: greptime_user
#    password: greptime_pwd

remote_read:
- url: http://localhost:4000/v1/prometheus/read?db=public
# Uncomment and set credentials if authentication is enabled
#  basic_auth:
#    username: greptime_user
#    password: greptime_pwd
- The host and port in the URL represent the GreptimeDB server. In this example, the server is running on
localhost:4000. You can replace it with your own server address. For the HTTP protocol configuration in GreptimeDB, please refer to the protocol options. - The
dbparameter in the URL represents the database to which we want to write data. It is optional. By default, the database is set topublic. basic_authis the authentication configuration. Fill in the username and password if GreptimeDB authentication is enabled. Please refer to the authentication document.
Grafana Alloy configuration file
If you are using Grafana Alloy, configure the remote write endpoint in the Alloy configuration file (config.alloy). For more information, refer to the Alloy documentation.
Vector configuration file
If you use Vector, configure Remote Write in Vector's configuration file (vector.toml). For more information, see the Vector documentation.
Data Model
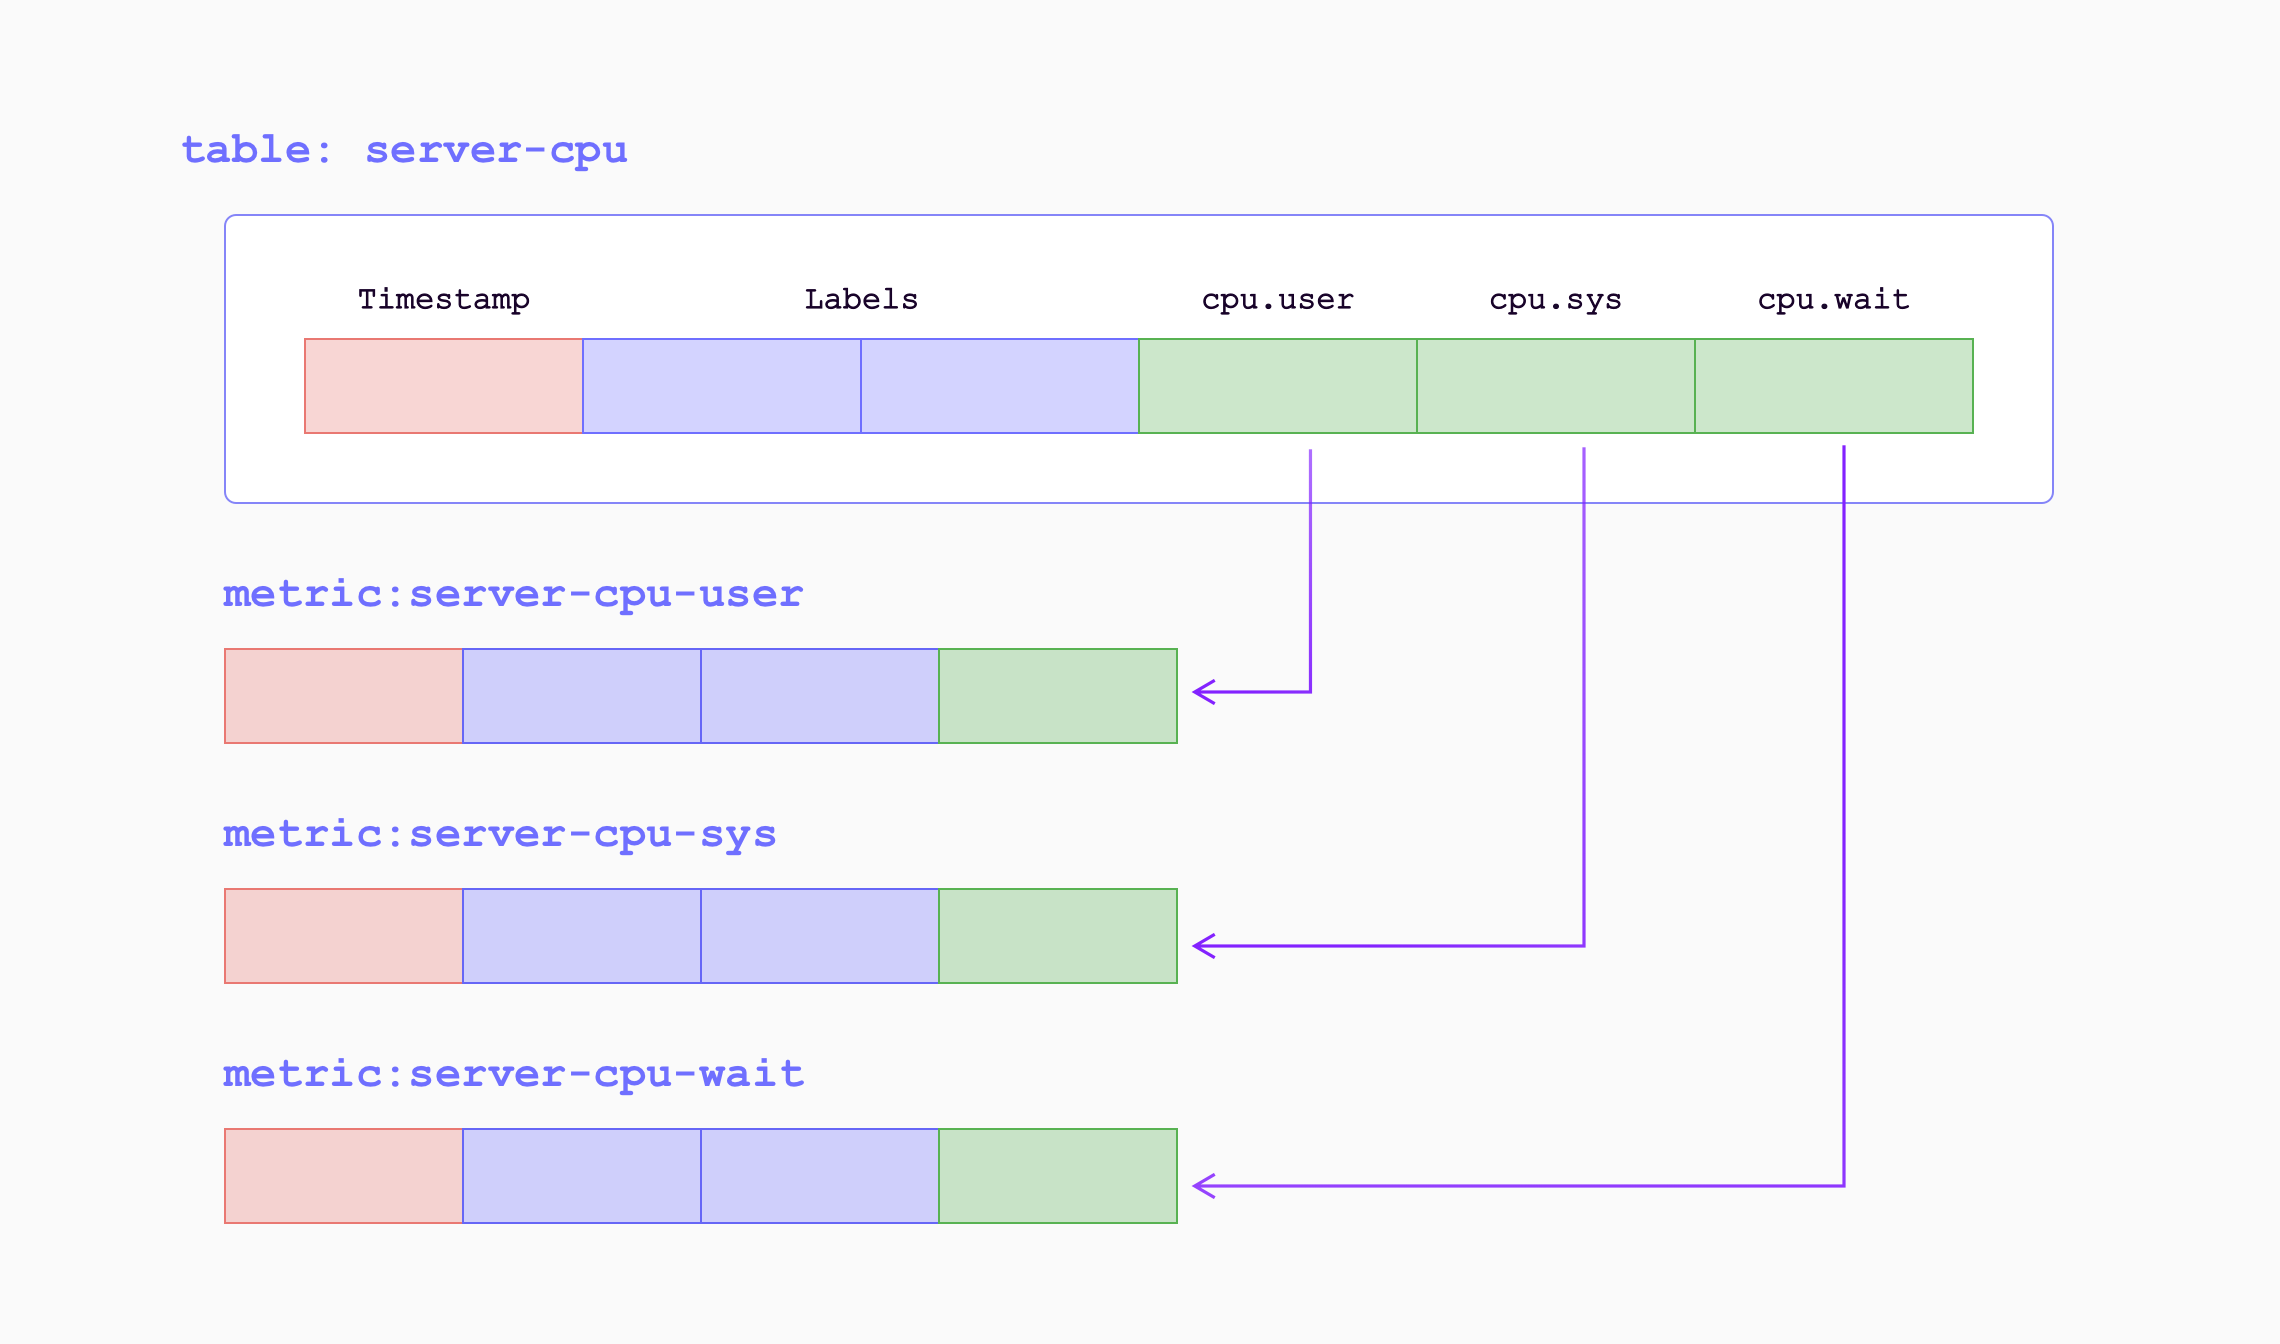
In the data model of GreptimeDB, data is organized into tables with columns for tags, time index, and fields. GreptimeDB can be thought of as a multi-value data model, automatically grouping multiple Prometheus metrics into corresponding tables. This allows for efficient data management and querying.
When the metrics are written into GreptimeDB by remote write endpoint, they will be transformed as follows:
| Sample Metrics | In GreptimeDB | GreptimeDB Data Types |
|---|---|---|
| Name | Table (Auto-created) Name | String |
| Value | Column (Field) | Double |
| Timestamp | Column (Time Index) | Timestamp |
| Label | Column (Tag) | String |
For example, the following Prometheus metric:
prometheus_remote_storage_samples_total{instance="localhost:9090", job="prometheus",
remote_name="648f0c", url="http://localhost:4000/v1/prometheus/write"} 500
will be transformed as a row in the table prometheus_remote_storage_samples_total:
| Column | Value | Column Data Type |
|---|---|---|
| instance | localhost:9090 | String |
| job | prometheus | String |
| remote_name | 648f0c | String |
| url | http://localhost:4000/v1/prometheus/write | String |
| greptime_value | 500 | Double |
| greptime_timestamp | The sample's unix timestamp | Timestamp |
Improve efficiency by using metric engine
The Prometheus remote writing always creates a large number of small tables. These tables are classified as logical tables in GreptimeDB. However, having a large number of small tables can be inefficient for both data storage and query performance. To address this, GreptimeDB introduces the metric engine feature, which stores the data represented by the logical tables in a single physical table. This approach reduces storage overhead and improves columnar compression efficiency.
The metric engine is enabled by default in GreptimeDB,
and you don't need to specify any additional configuration.
By default, the physical table used is greptime_physical_table.
If you want to use a specific physical table, you can specify the physical_table parameter in the remote write URL.
If the specified physical table doesn't exist, it will be automatically created.
remote_write:
- url: http://localhost:4000/v1/prometheus/write?db=public&physical_table=greptime_physical_table
Data is stored in the physical table, while queries are performed on logical tables to provide an intuitive view from a metric perspective. For instance, when successfully writing data, you can use the following command to display the logical tables:
show tables;
+---------------------------------------------------------------+
| Tables                                                        |
+---------------------------------------------------------------+
| prometheus_remote_storage_enqueue_retries_total               |
| prometheus_remote_storage_exemplars_pending                   |
| prometheus_remote_storage_read_request_duration_seconds_count |
| prometheus_rule_group_duration_seconds                        |
| ......                                                        |
+---------------------------------------------------------------+
The physical table itself can also be queried. It contains columns from all the logical tables, making it convenient for multi-join analysis and computation.
To view the schema of the physical table, use the DESC TABLE command:
DESC TABLE greptime_physical_table;
The physical table includes all the columns from the logical tables:
+--------------------+----------------------+------+------+---------+---------------+
| Column             | Type                 | Key  | Null | Default | Semantic Type |
+--------------------+----------------------+------+------+---------+---------------+
| greptime_timestamp | TimestampMillisecond | PRI  | NO   |         | TIMESTAMP     |
| greptime_value     | Float64              |      | YES  |         | FIELD         |
| __table_id         | UInt32               | PRI  | NO   |         | TAG           |
| __tsid             | UInt64               | PRI  | NO   |         | TAG           |
| device             | String               | PRI  | YES  |         | TAG           |
| instance           | String               | PRI  | YES  |         | TAG           |
| job                | String               | PRI  | YES  |         | TAG           |
| error              | String               | PRI  | YES  |         | TAG           |
...
You can use the SELECT statement to filter data from the physical table as needed.
For example, you can filter data based on the device condition from logical table A and the job condition from logical table B:
SELECT *
FROM greptime_physical_table
WHERE greptime_timestamp > "2024-08-07 03:27:26.964000"
  AND device = "device1"
  AND job = "job1";
GreptimeDB cluster with metric engine
If you are using GreptimeDB cluster for Prometheus remote write, you may notice that only 1 datanode taking all the workload and other datanodes receives no traffic. This is because with default settings, there is only 1 metric engine physical table, and only 1 partition(region) in that table. The datanode that serves the partition will take all the data ingestion.
Why we are not creating more partitions by default? GreptimeDB's table partition is based pre-configured partition columns. However, in Prometheus ecosystem, there is no common column (label, as in Prometheus) that is suitable for good partition rules.
To fix this, we recommend you to define your own partition rule based on your
data model. For example, it can be namespace if your are monitoring a
kubernetes cluster. The partition columns should have enough cardinality to
divide data. Also we recommend you to create 2x-3x partitions on initial
datanode count, so when you scaling more datanodes in your cluster, just migrate
those partitions to new ones.
An example DDL of partitioned physical table based on namespace label:
CREATE TABLE greptime_physical_table (
    greptime_timestamp TIMESTAMP(3) NOT NULL,
    greptime_value DOUBLE NULL,
    namespace STRING PRIMARY KEY,
    TIME INDEX (greptime_timestamp),
)
PARTITION ON COLUMNS (namespace) (
  namespace <'g',
  namespace >= 'g' AND namespace < 'n',
  namespace >= 'n' AND namespace < 't',
  namespace >= 't'
)
ENGINE = metric
with (
    "physical_metric_table" = "",
);
Note that you won't have need add all possible PRIMARY KEY (label) here, metric engine will add them automatically. Only labels you use for partitioning are required to be defined ahead of time.
Special labels for ingestion options
This experimental feature may contain unexpected behavior, have its functionality change in the future.
Normally, the complete dataset of a remote write request is ingested into the database under the same option, for example, a default physical table with metric engine enabled. All the logical tables (i.e, the metrics) is backed with the same physical table, even when the number of metrics grows. It's probably fine for data ingestion. However, this set-up might slow down the query speed if you just want to query for a small group of metrics, but the database have to scan the complete dataset because they are all in the same physical table.
If you can foresee a large data volume and incremental queries upon a small group of metrics each time, then it might be useful to split the storage during the ingestion to reduce the query overhead later. This fine-grade level of control can be achieved using ingest options for each metric within a remote request.
Starting from v0.15, GreptimeDB is adding support for special labels.
There labels (along with there values) will turn into ingest options during the parsing phase, allowing individual metric within a request to be more precisely controlled.
The labels are not mutually exclusive, so they can be combined together to produce more versatile controlling.
Here is a representative diagram of special labels for a metric. Note this is not the actual data model of a metric.
__name__ | x_greptime_database | x_greptime_physical_table | pod_name_label | __normal_label_with_underscore_prefix__ | timestamp | value |
|---|---|---|---|---|---|---|
some_metric_name | public | p_1 | random_k8s_pod_name | true | 2025-06-17 16:31:52.000 | 12.1 |
The special labels you see above are just normal valid labels in Prometheus. GreptimeDB recognizes some of the label names and turns them into ingest options. It's much like the custom HTTP headers, where you just set a valid HTTP header and its value to indicate following operations, only the header pair means nothing outside your program.
Here is a list of supported label names:
x_greptime_databasex_greptime_physical_table
Setting labels
How to set labels to the metrics is very dependent on the tools (or code) that collects the metrics and send them over to the database.
If you're using Prometheus to scrape metrics from the source and send them to GreptimeDB using remote write, you can add external_labels in the global config.
Refer to the docs here.
It's the same for other collecting tools. You may have to find the relevant configuration for your tool of choice.
x_greptime_database
This option decides which database the metric goes into. Note, the database should be created in advance(for instance, using create database xxx SQL).
Metrics from the same tech stack can have same metric names. For example, if you have two Kubernetes clusters with very different content, and you deploy a single collector on both clusters, they will generate metrics with same names but with different labels or values. If the metrics are collected and ingested into the same database, then on a Grafana dashboard you will have to manually set every label selection on every diagram to view the two clusters' metrics separately. This can be very tedious and painful.
In this case, you might want to store the metrics on different databases during ingestion and use two dashboards to view the metrics separately.
x_greptime_physical_table
If the metric is storing using the metric engine, then there is a physical table behind each metric's logical table. By default, all metrics using the same physical table. With the number of the metrics growing, this physical table becomes a super wide table. If the metric frequency is different, then the table will be sparse. Finding a certain metric or a certain label in the complete metrics dataset would be very time-consuming since the database have to scan all the 'irrelevant' data.
In this case, you might want to split the metrics into different physical tables to ease the pressure on a single physical table. It can also be helpful to group metrics by their frequency.
Note, each metric's logical table is bound to a physical table upon creation. So setting different physical table for the same metric within the same database won't work.
Using pipeline in remote write
This experimental feature may contain unexpected behavior, have its functionality change in the future.
Starting from v0.15, GreptimeDB supports using pipeline to process Prometheus remote write requests.
You can simply set the HTTP header x-greptime-pipeline-name to the target pipeline name to enable pipeline processing.
Here is a very simple pipeline configuration, using vrl processor to add a source label to each metric:
version: 2
processors:
  - vrl:
      source: |
        .source = "local_laptop"
        .

transform:
  - field: greptime_timestamp
    type: time, ms
    index: timestamp
The result looks something like this
mysql> select * from `go_memstats_mcache_inuse_bytes`;
+----------------------------+----------------+--------------------+---------------+--------------+
| greptime_timestamp         | greptime_value | instance           | job           | source       |
+----------------------------+----------------+--------------------+---------------+--------------+
| 2025-07-11 07:42:03.064000 |           1200 | node_exporter:9100 | node-exporter | local_laptop |
| 2025-07-11 07:42:18.069000 |           1200 | node_exporter:9100 | node-exporter | local_laptop |
+----------------------------+----------------+--------------------+---------------+--------------+
2 rows in set (0.01 sec)
You can refer to the pipeline's documentation for more details.
Performance tuning
Batching mode
When the metric engine is enabled, GreptimeDB supports a batching mode for Prometheus Remote Write that reduces per-request overhead and improves ingestion throughput. In batching mode, incoming rows are accumulated and flushed to the metric engine in larger batches, which can yield up to 2x throughput improvement in clustered deployments with multiple regions, but requires careful tuning of batch parameters to match the ingestion workload and prevent increased latency.
Batching mode is disabled by default.
To enable it, set pending_rows_flush_interval to a non-zero duration in the [prom_store] section of the configuration file:
[prom_store]
enable = true
with_metric_engine = true
pending_rows_flush_interval = "500ms"
The following table describes the batching-related options:
| Key | Type | Default | Description |
|---|---|---|---|
| pending_rows_flush_interval | String | "0s" | Interval between batch flushes. "0s" disables batching. |
| max_batch_rows | Integer | 100000 | Maximum number of rows per batch before a flush is triggered. |
| max_concurrent_flushes | Integer | 256 | Maximum number of flush operations that can run concurrently. |
| max_inflight_requests | Integer | 3000 | Maximum number of in-flight write requests waiting for batch completion. |
Batching mode only takes effect when both with_metric_engine is true and pending_rows_flush_interval is set to a non-zero duration.
Customized physical table
By default, the metric engine will automatically create a physical table named greptime_physical_table if it does not already exist. For performance optimization, you may choose to create a physical table with customized configurations.
Enable skipping index
By default, the metric engine won't create indexes for columns. You can enable it by setting the index.type to skipping.
Create a physical table with a skipping index; all automatically added columns will have this index applied.
CREATE TABLE greptime_physical_table (
    greptime_timestamp TIMESTAMP(3) NOT NULL,
    greptime_value DOUBLE NULL,
    TIME INDEX (greptime_timestamp),
)
engine = metric
with (
    "physical_metric_table" = "",
    "index.type" = "skipping"
);
For more configurations, please refer to the create table section.
VictoriaMetrics remote write
VictoriaMetrics slightly modified Prometheus remote write protocol for better
compression. The protocol is automatically enabled when you are using vmagent
to send data to a compatible backend.
GreptimeDB has this variant supported, too. Just configure GreptimeDB's remote
write url for vmagent. For example, if you have GreptimeDB installed locally:
vmagent -remoteWrite.url=http://localhost:4000/v1/prometheus/write