Tracing
GreptimeDB supports distributed tracing. GreptimeDB exports all collected spans using the gRPC-based OTLP protocol. Users can use Jaeger, Tempo and other OTLP protocol backends that support gRPC to collect the span instrument by GreptimeDB.
In the logging section in the configuration, there are descriptions of configuration items related to tracing, standalone.example.toml provide a reference configuration in the logging section.
Tutorial: Use Jaeger to trace GreptimeDB
Jaeger is an open source, end-to-end distributed tracing system, originally developed and open sourced by Uber. Its goal is to help developers monitor and debug the request flow in complex microservice architectures.
Jaeger supports gRPC-based OTLP protocol, so GreptimeDB can export trace data to Jaeger. The following tutorial shows you how to deploy and use Jaeger to track GreptimeDB.
Step 1: Deploy Jaeger
Start a Jaeger instance using the all-in-one docker image officially provided by jaeger:
docker run --rm -d --name jaeger \
   -e COLLECTOR_ZIPKIN_HOST_PORT=:9411 \
   -p 6831:6831/udp \
   -p 6832:6832/udp \
   -p 5778:5778 \
   -p 16686:16686 \
   -p 4317:4317 \
   -p 4318:4318 \
   -p 14250:14250 \
   -p 14268:14268 \
   -p 14269:14269 \
   -p 9411:9411 \
   jaegertracing/all-in-one:latest
docker run --rm -d --name jaeger \
-e COLLECTOR_ZIPKIN_HOST_PORT=:9411 \
-p 6831:6831/udp \
-p 6832:6832/udp \
-p 5778:5778 \
-p 16686:16686 \
-p 4317:4317 \
-p 4318:4318 \
-p 14250:14250 \
-p 14268:14268 \
-p 14269:14269 \
-p 9411:9411 \
jaegertracing/all-in-one:latestStep 2: Deploy GreptimeDB
Write configuration files to allow GreptimeDB to perform tracing. Save the following configuration items as the file config.toml
[logging]
enable_otlp_tracing = true[logging]
enable_otlp_tracing = trueThen start GreptimeDB using standalone mode
greptime standalone start -c config.tomlgreptime standalone start -c config.tomlRefer to the chapter Mysql on how to connect to GreptimeDB. Run the following SQL statement in Mysql Client:
CREATE TABLE host (
   ts timestamp(3) time index,
   host STRING PRIMARY KEY,
   val BIGINT,
);

INSERT INTO TABLE host VALUES
     (0, 'host1', 0),
     (20000, 'host2', 5);

SELECT * FROM host ORDER BY ts;

DROP TABLE host;
CREATE TABLE host (
ts timestamp(3) time index,
host STRING PRIMARY KEY,
val BIGINT,
);
INSERT INTO TABLE host VALUES
(0, 'host1', 0),
(20000, 'host2', 5);
SELECT * FROM host ORDER BY ts;
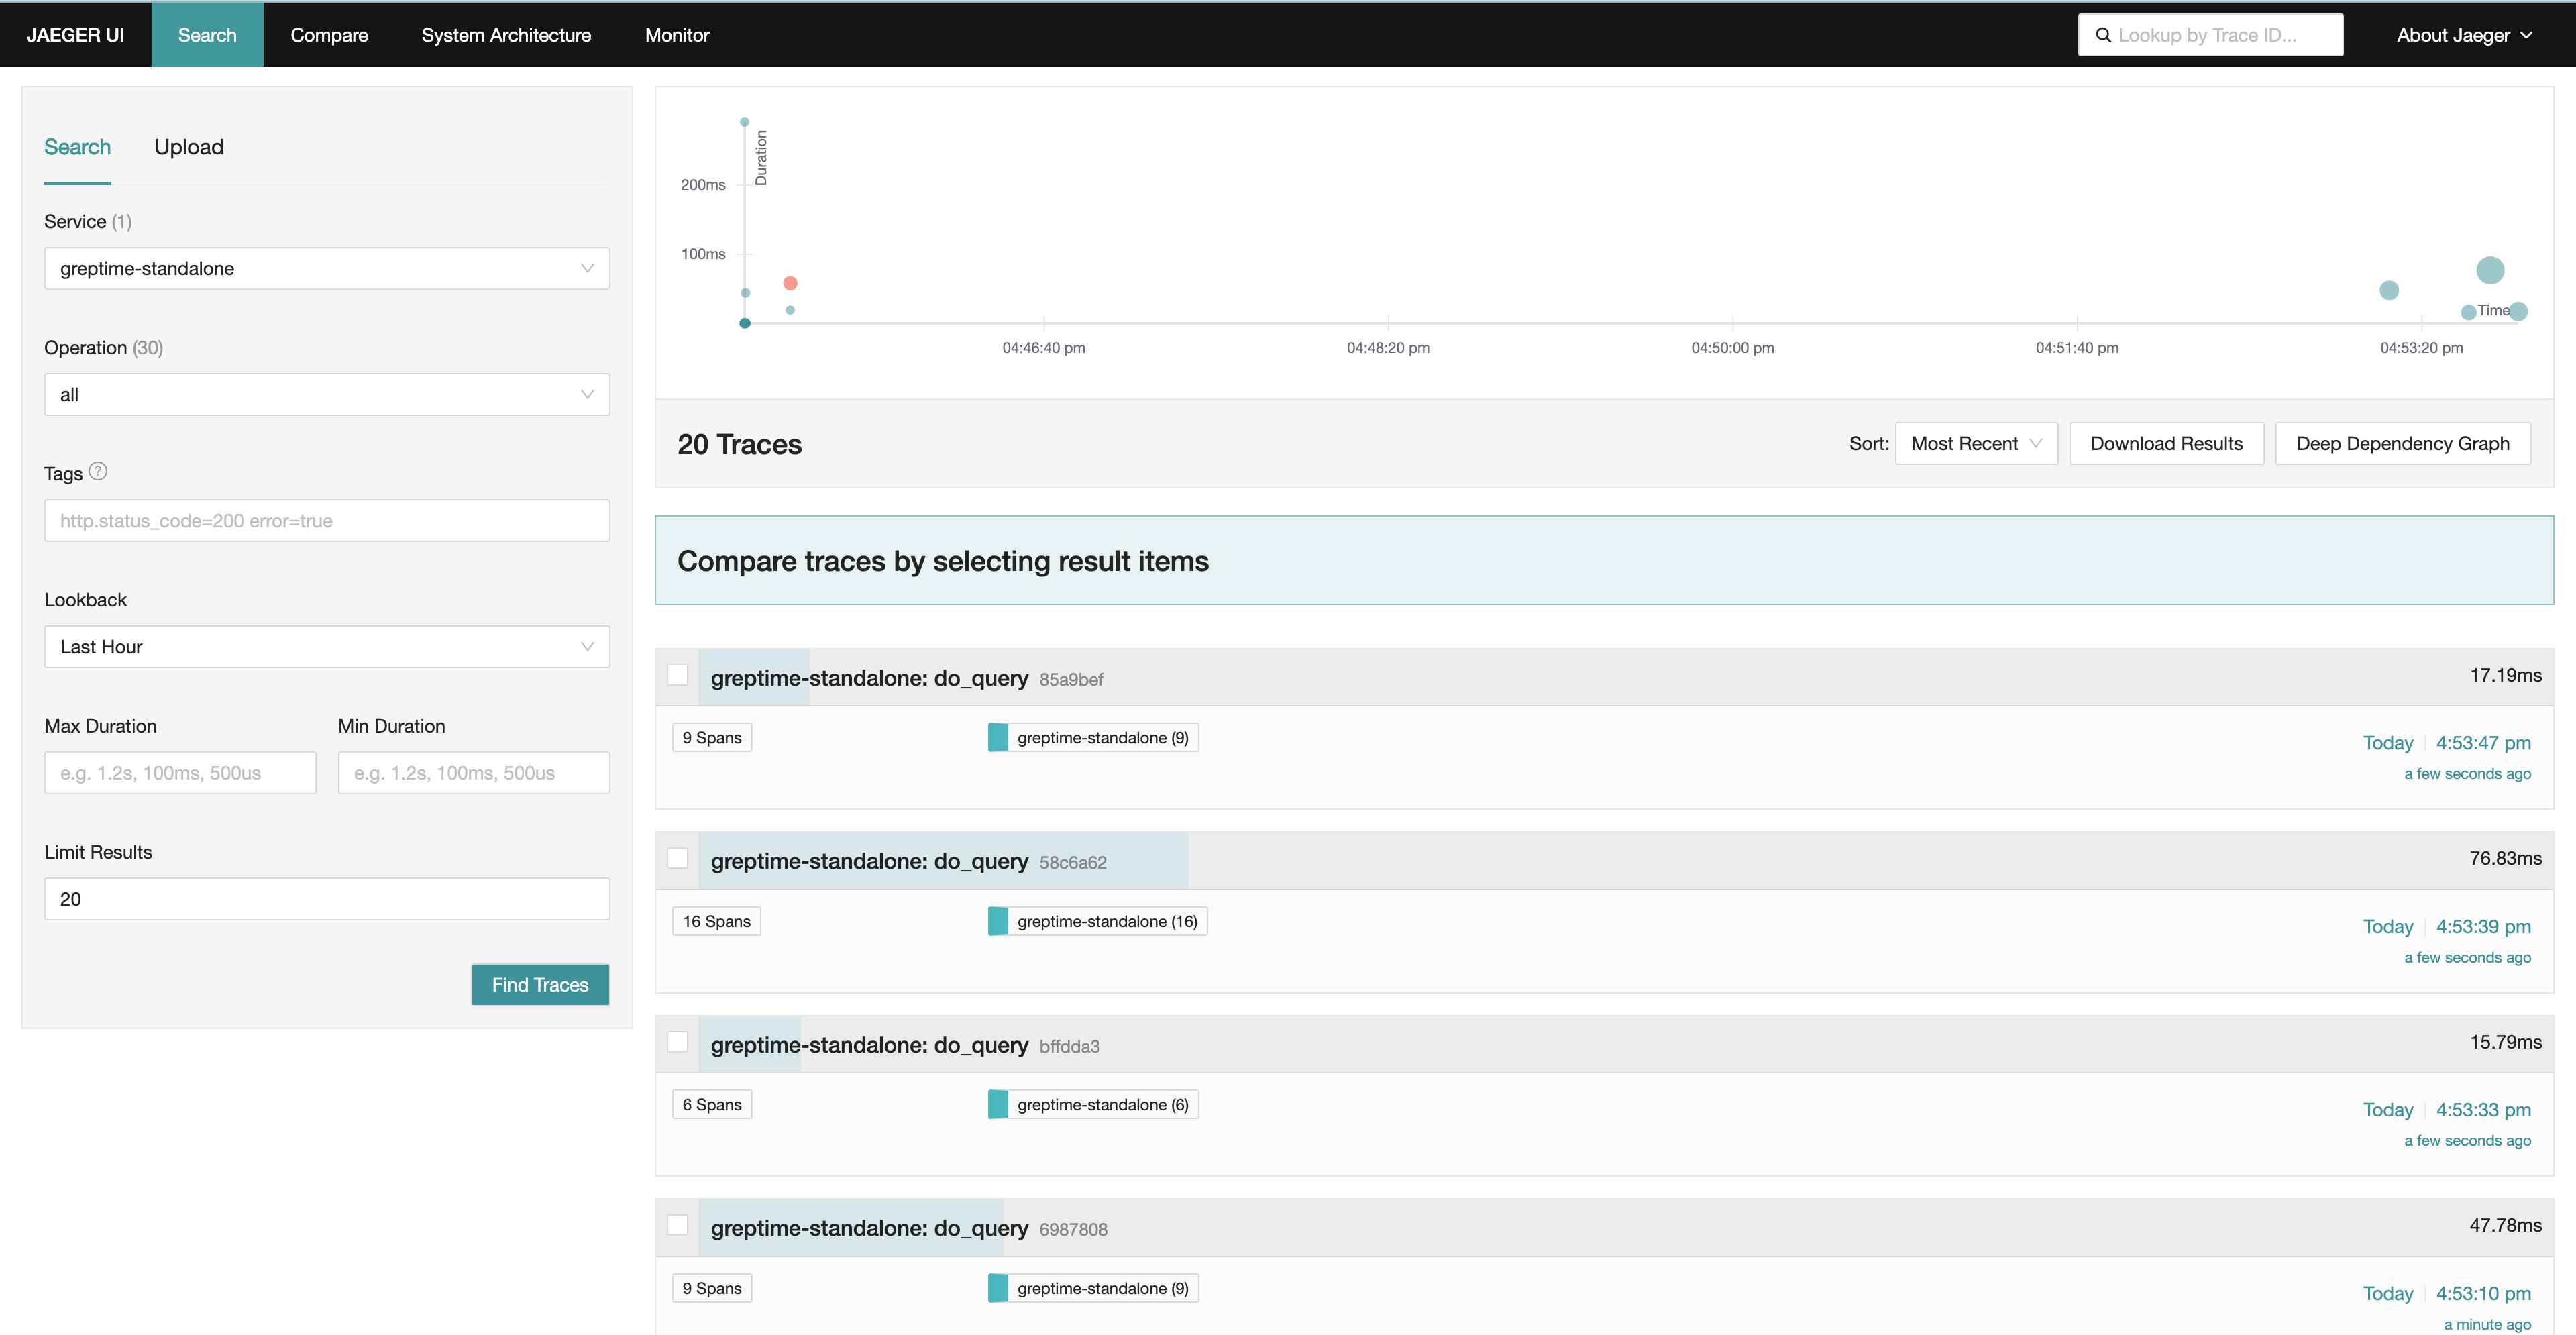
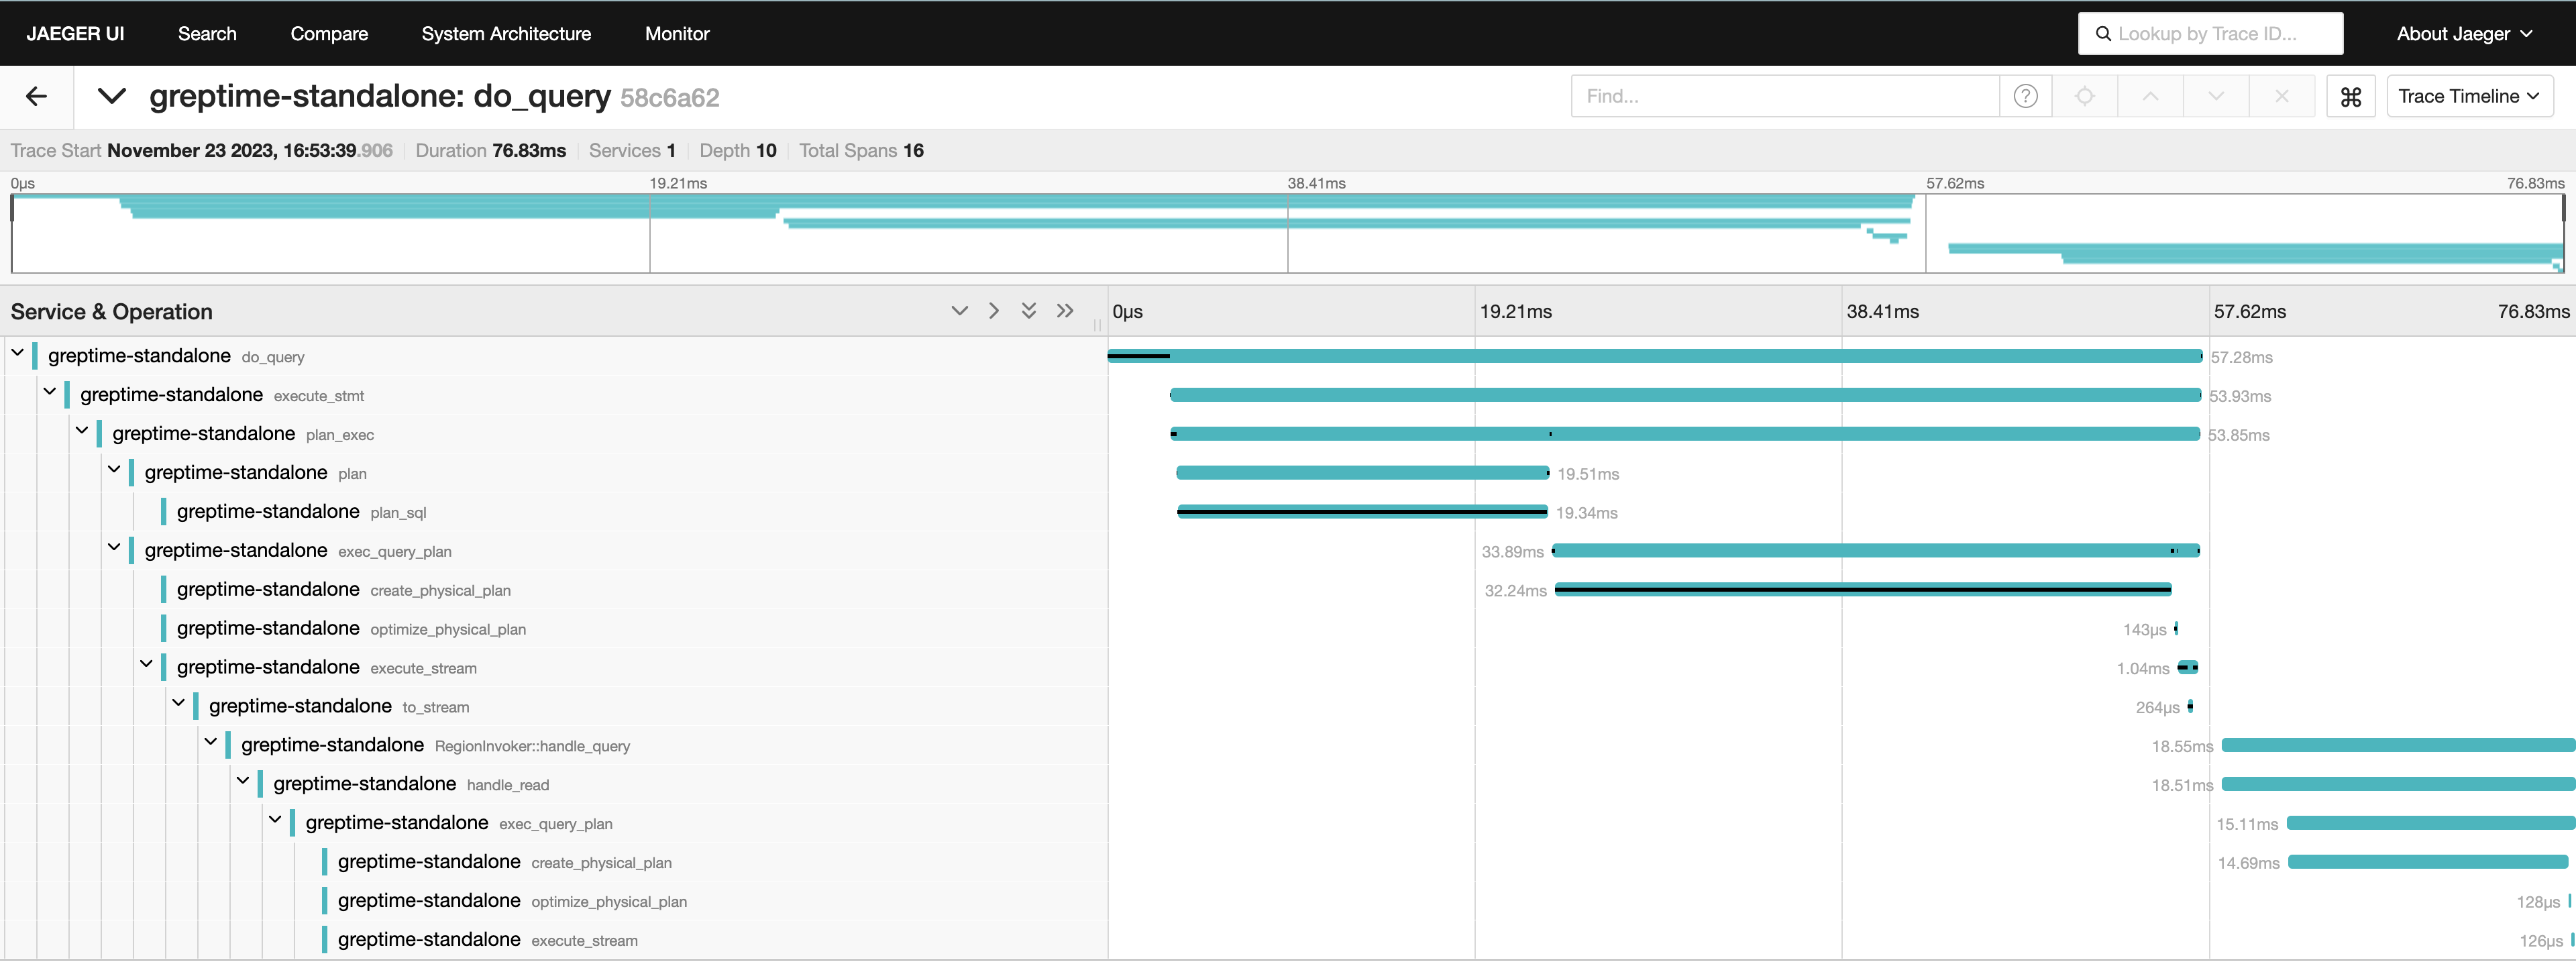
DROP TABLE host;Step 3: Obtain trace information in Jaeger
- Go to http://127.0.0.1:16686/ and select the Search tab.
- Select the
greptime-standaloneservice in the service drop-down list. - Click Find Traces to display trace information.