SQL
GreptimeDB supports full SQL for you to query data from a database. Here are some query examples for the monitor so you can get familiar with using SQL alongside GreptimeDB functions.
For examples on how to create the monitor table and insert data into it, Please refer to table management and write data.
SELECT
To select all the data from the monitor table, use the SELECT statement:
SELECT * FROM monitor;SELECT * FROM monitor;The query result looks like the following:
+-----------+---------------------+------+--------+
| host      | ts                  | cpu  | memory |
+-----------+---------------------+------+--------+
| 127.0.0.1 | 2022-11-03 03:39:57 |  0.1 |    0.4 |
| 127.0.0.1 | 2022-11-03 03:39:58 |  0.5 |    0.2 |
| 127.0.0.2 | 2022-11-03 03:39:58 |  0.2 |    0.3 |
+-----------+---------------------+------+--------+
3 rows in set (0.00 sec)+-----------+---------------------+------+--------+
| host | ts | cpu | memory |
+-----------+---------------------+------+--------+
| 127.0.0.1 | 2022-11-03 03:39:57 | 0.1 | 0.4 |
| 127.0.0.1 | 2022-11-03 03:39:58 | 0.5 | 0.2 |
| 127.0.0.2 | 2022-11-03 03:39:58 | 0.2 | 0.3 |
+-----------+---------------------+------+--------+
3 rows in set (0.00 sec)Please refer to SELECT for more information.
Use functions
You can use the count() function to get the number of all rows in the table:
SELECT count(*) FROM monitor;SELECT count(*) FROM monitor;+-----------------+
| COUNT(UInt8(1)) |
+-----------------+
| 3 |
+-----------------++-----------------+
| COUNT(UInt8(1)) |
+-----------------+
| 3 |
+-----------------+The avg() function returns the average value of a certain field:
SELECT avg(cpu) FROM monitor;SELECT avg(cpu) FROM monitor;+---------------------+
| AVG(monitor.cpu) |
+---------------------+
| 0.26666666666666666 |
+---------------------+
1 row in set (0.00 sec)+---------------------+
| AVG(monitor.cpu) |
+---------------------+
| 0.26666666666666666 |
+---------------------+
1 row in set (0.00 sec)Query latest 5 minutes of data
SELECT * from monitor WHERE ts >= now() - INTERVAL '5 minutes';SELECT * from monitor WHERE ts >= now() - INTERVAL '5 minutes';Please refer to INTERVAL for more information.
Cast number literal to timestamp
select * from monitor where ts > arrow_cast(1650252336408, 'Timestamp(Millisecond, None)');select * from monitor where ts > arrow_cast(1650252336408, 'Timestamp(Millisecond, None)');This query casts the number literal 1650252336408 (Unix Epoch 2022-04-18 03:25:36.408 in millisecond resolution) to the timestamp type with millisecond precision.
Please refer to arrow_cast for more information.
Cast string literal to timestamp
select * from monitor where ts > '2022-07-25 10:32:16.408'::timestamp;select * from monitor where ts > '2022-07-25 10:32:16.408'::timestamp;This query uses the :: grammar to cast the string literal to the timestamp type. All the SQL types are valid to be in the position of timestamp.
Please refer to ::timestamp for more information.
Extract the day of the year from timestamp
SELECT date_part('DOY', '2021-07-01 00:00:00');SELECT date_part('DOY', '2021-07-01 00:00:00');Output:
+----------------------------------------------------+
| date_part(Utf8("DOY"),Utf8("2021-07-01 00:00:00")) |
+----------------------------------------------------+
|                                                182 |
+----------------------------------------------------+
1 row in set (0.003 sec)+----------------------------------------------------+
| date_part(Utf8("DOY"),Utf8("2021-07-01 00:00:00")) |
+----------------------------------------------------+
| 182 |
+----------------------------------------------------+
1 row in set (0.003 sec)The DOY in the SQL statement is the abbreviation of day of the year. Please refer to date_part for more information.
Please refer to Functions for more information.
Group By
You can use the GROUP BY clause to group rows that have the same values into summary rows. The average memory usage grouped by idc:
SELECT host, avg(cpu) FROM monitor GROUP BY host;SELECT host, avg(cpu) FROM monitor GROUP BY host;+-----------+------------------+
| host | AVG(monitor.cpu) |
+-----------+------------------+
| 127.0.0.2 | 0.2 |
| 127.0.0.1 | 0.3 |
+-----------+------------------+
2 rows in set (0.00 sec)+-----------+------------------+
| host | AVG(monitor.cpu) |
+-----------+------------------+
| 127.0.0.2 | 0.2 |
| 127.0.0.1 | 0.3 |
+-----------+------------------+
2 rows in set (0.00 sec)Please refer to GROUP BY for more information.
Aggregate data by time
GreptimeDB supports Range Query to aggregate data by time.
Suppose we have the following data in the monitor table:
+-----------+---------------------+------+--------+
| host      | ts                  | cpu  | memory |
+-----------+---------------------+------+--------+
| 127.0.0.1 | 2023-12-13 02:05:41 |  0.5 |    0.2 |
| 127.0.0.1 | 2023-12-13 02:05:46 | NULL |   NULL |
| 127.0.0.1 | 2023-12-13 02:05:51 |  0.4 |    0.3 |
| 127.0.0.2 | 2023-12-13 02:05:41 |  0.3 |    0.1 |
| 127.0.0.2 | 2023-12-13 02:05:46 | NULL |   NULL |
| 127.0.0.2 | 2023-12-13 02:05:51 |  0.2 |    0.4 |
+-----------+---------------------+------+--------++-----------+---------------------+------+--------+
| host | ts | cpu | memory |
+-----------+---------------------+------+--------+
| 127.0.0.1 | 2023-12-13 02:05:41 | 0.5 | 0.2 |
| 127.0.0.1 | 2023-12-13 02:05:46 | NULL | NULL |
| 127.0.0.1 | 2023-12-13 02:05:51 | 0.4 | 0.3 |
| 127.0.0.2 | 2023-12-13 02:05:41 | 0.3 | 0.1 |
| 127.0.0.2 | 2023-12-13 02:05:46 | NULL | NULL |
| 127.0.0.2 | 2023-12-13 02:05:51 | 0.2 | 0.4 |
+-----------+---------------------+------+--------+The following query returns the average CPU usage in a 10-second time range and calculates it every 5 seconds:
SELECT
    ts,
    host,
    avg(cpu) RANGE '10s' FILL LINEAR
FROM monitor
ALIGN '5s' TO '2023-12-01T00:00:00' BY (host);
SELECT
ts,
host,
avg(cpu) RANGE '10s' FILL LINEAR
FROM monitor
ALIGN '5s' TO '2023-12-01T00:00:00' BY (host);avg(cpu) RANGE '10s' FILL LINEARis a Range expression.RANGE '10s'specifies that the time range of the aggregation is 10s, andFILL LINEARspecifies that if there is no data within a certain aggregation time, use theLINEARmethod to fill it.ALIGN '5s'specifies the that data statistics should be performed in steps of 5s.TO '2023-12-01T00:00:00specifies the origin alignment time. The default value is Unix time 0.BY (host)specifies the aggregate key. If theBYkeyword is omitted, the primary key of the data table is used as the aggregate key by default.
The Response is shown below:
+---------------------+-----------+----------------------------------------+
| ts                  | host      | AVG(monitor.cpu) RANGE 10s FILL LINEAR |
+---------------------+-----------+----------------------------------------+
| 2023-12-13 02:05:35 | 127.0.0.1 |                                    0.5 |
| 2023-12-13 02:05:40 | 127.0.0.1 |                                    0.5 |
| 2023-12-13 02:05:45 | 127.0.0.1 |                                    0.4 |
| 2023-12-13 02:05:50 | 127.0.0.1 |                                    0.4 |
| 2023-12-13 02:05:35 | 127.0.0.2 |                                    0.3 |
| 2023-12-13 02:05:40 | 127.0.0.2 |                                    0.3 |
| 2023-12-13 02:05:45 | 127.0.0.2 |                                    0.2 |
| 2023-12-13 02:05:50 | 127.0.0.2 |                                    0.2 |
+---------------------+-----------+----------------------------------------++---------------------+-----------+----------------------------------------+
| ts | host | AVG(monitor.cpu) RANGE 10s FILL LINEAR |
+---------------------+-----------+----------------------------------------+
| 2023-12-13 02:05:35 | 127.0.0.1 | 0.5 |
| 2023-12-13 02:05:40 | 127.0.0.1 | 0.5 |
| 2023-12-13 02:05:45 | 127.0.0.1 | 0.4 |
| 2023-12-13 02:05:50 | 127.0.0.1 | 0.4 |
| 2023-12-13 02:05:35 | 127.0.0.2 | 0.3 |
| 2023-12-13 02:05:40 | 127.0.0.2 | 0.3 |
| 2023-12-13 02:05:45 | 127.0.0.2 | 0.2 |
| 2023-12-13 02:05:50 | 127.0.0.2 | 0.2 |
+---------------------+-----------+----------------------------------------+Time range window
The origin time range window steps forward and backward in the time series to generate all time range windows. In the example above, the origin alignment time is set to 2023-12-01T00:00:00, which is also the end time of the origin time window.
The RANGE option, along with the origin alignment time, defines the origin time range window that starts from origin alignment timestamp and ends at origin alignment timestamp + range.
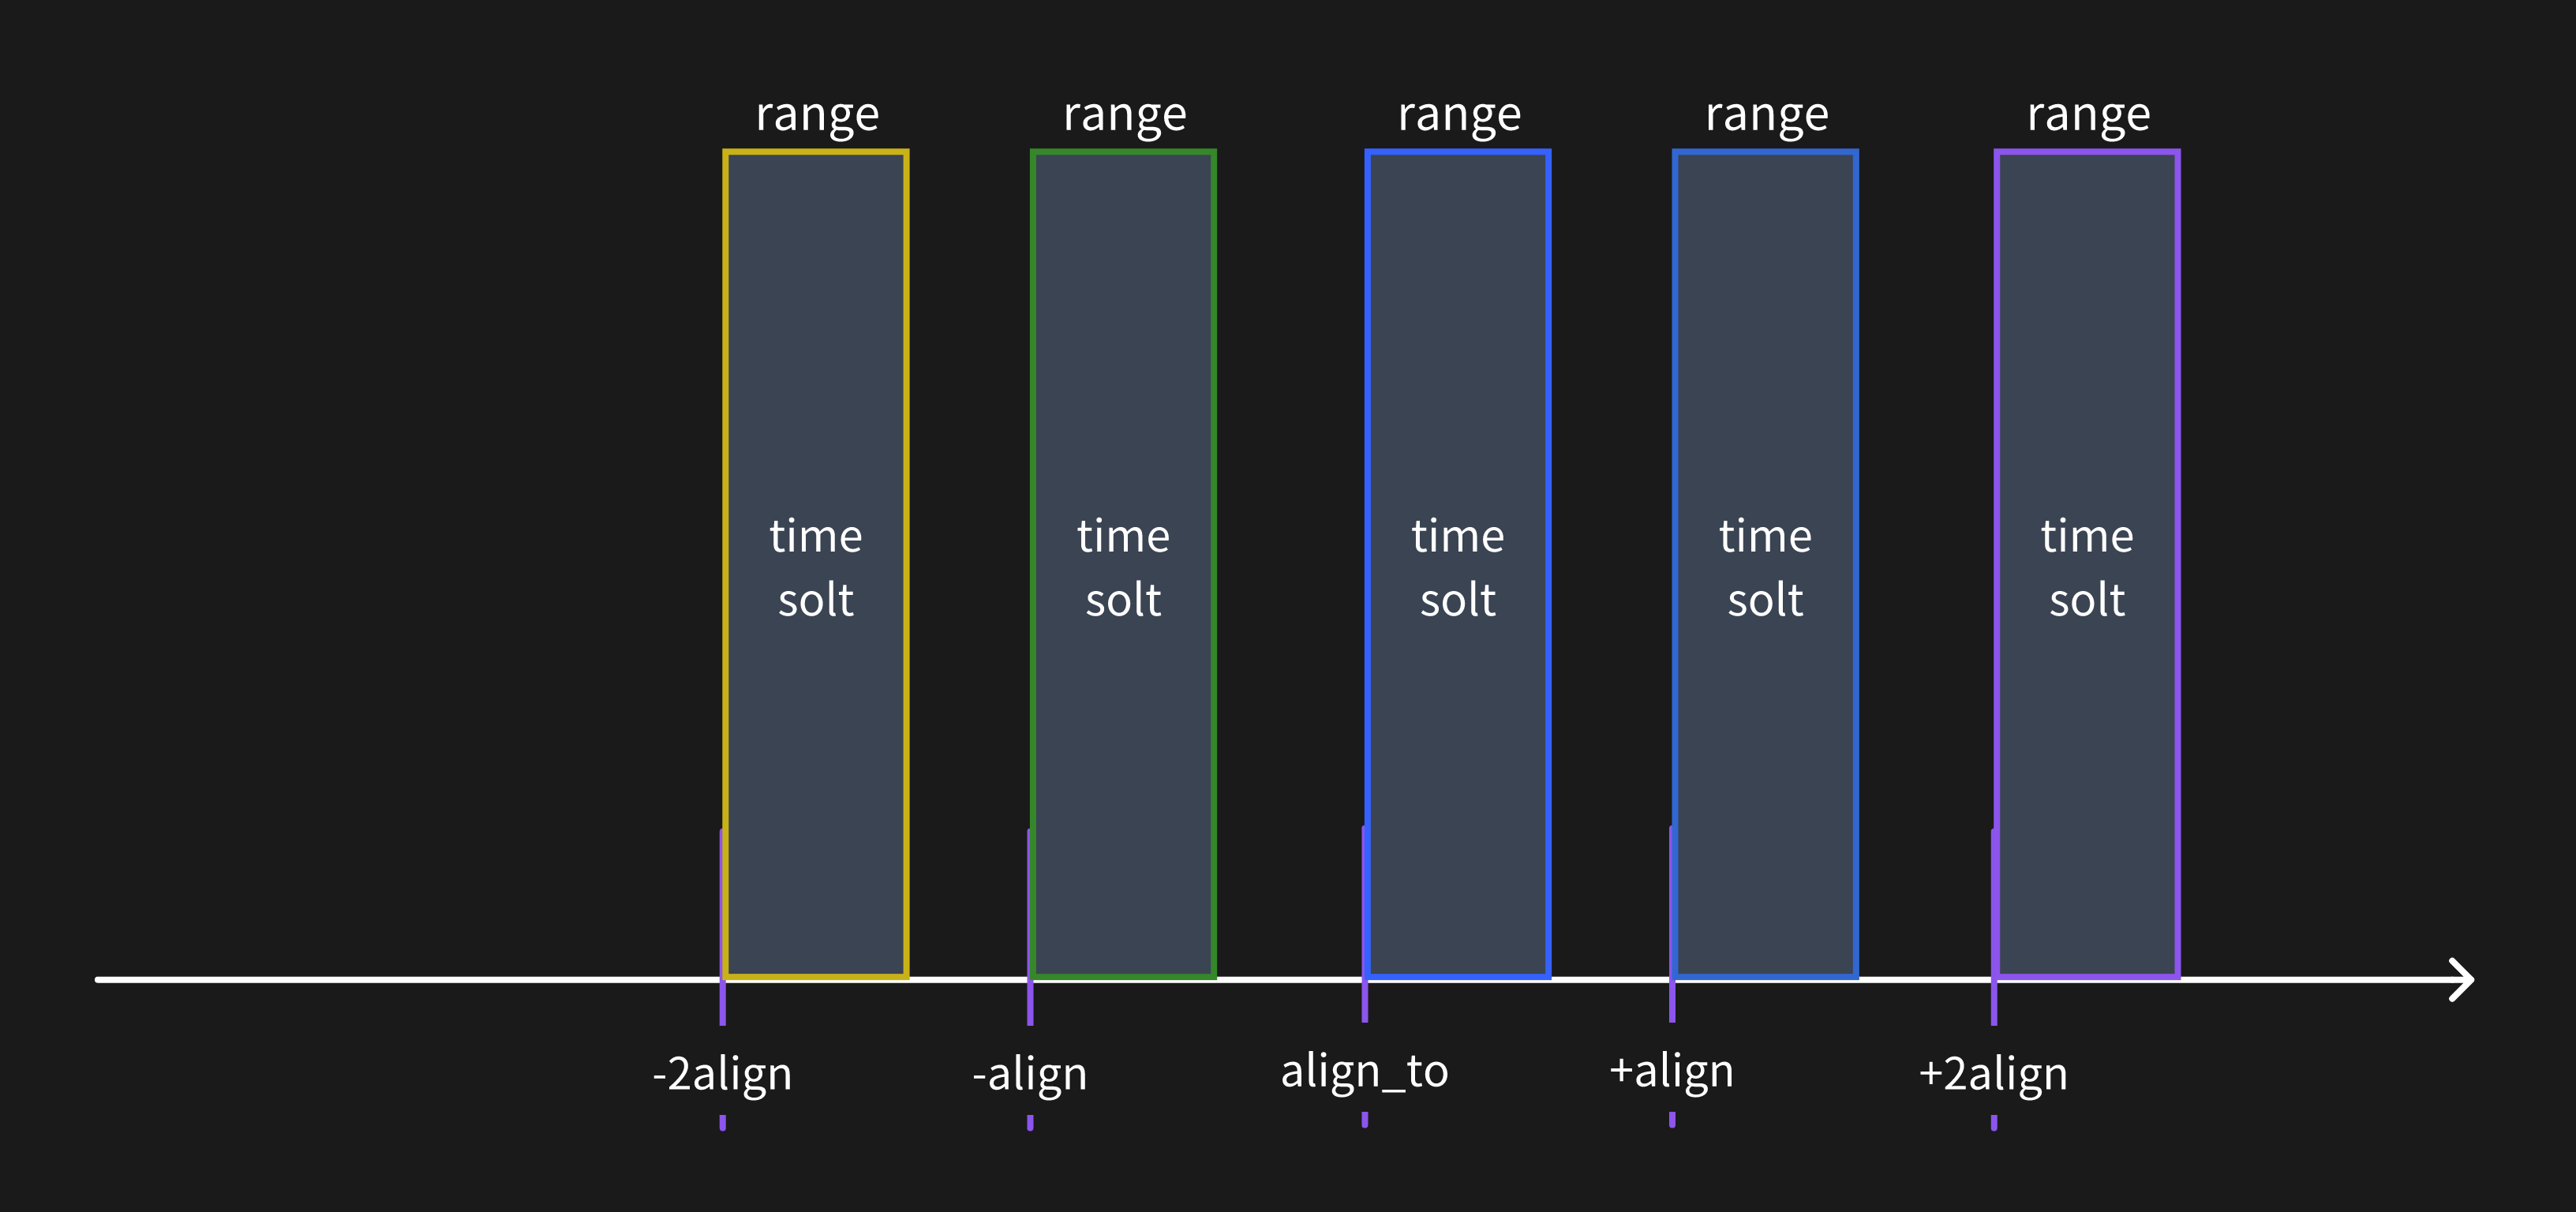
The ALIGN option defines the query resolution steps. It determines the calculation steps from the origin time window to other time windows. For example, with the origin alignment time 2023-12-01T00:00:00 and ALIGN '5s', the alignment times are 2023-11-30T23:59:55, 2023-12-01T00:00:00, 2023-12-01T00:00:05, 2023-12-01T00:00:10, and so on.
These time windows are left-closed and right-open intervals that satisfy the condition [alignment timestamp, alignment timestamp + range).
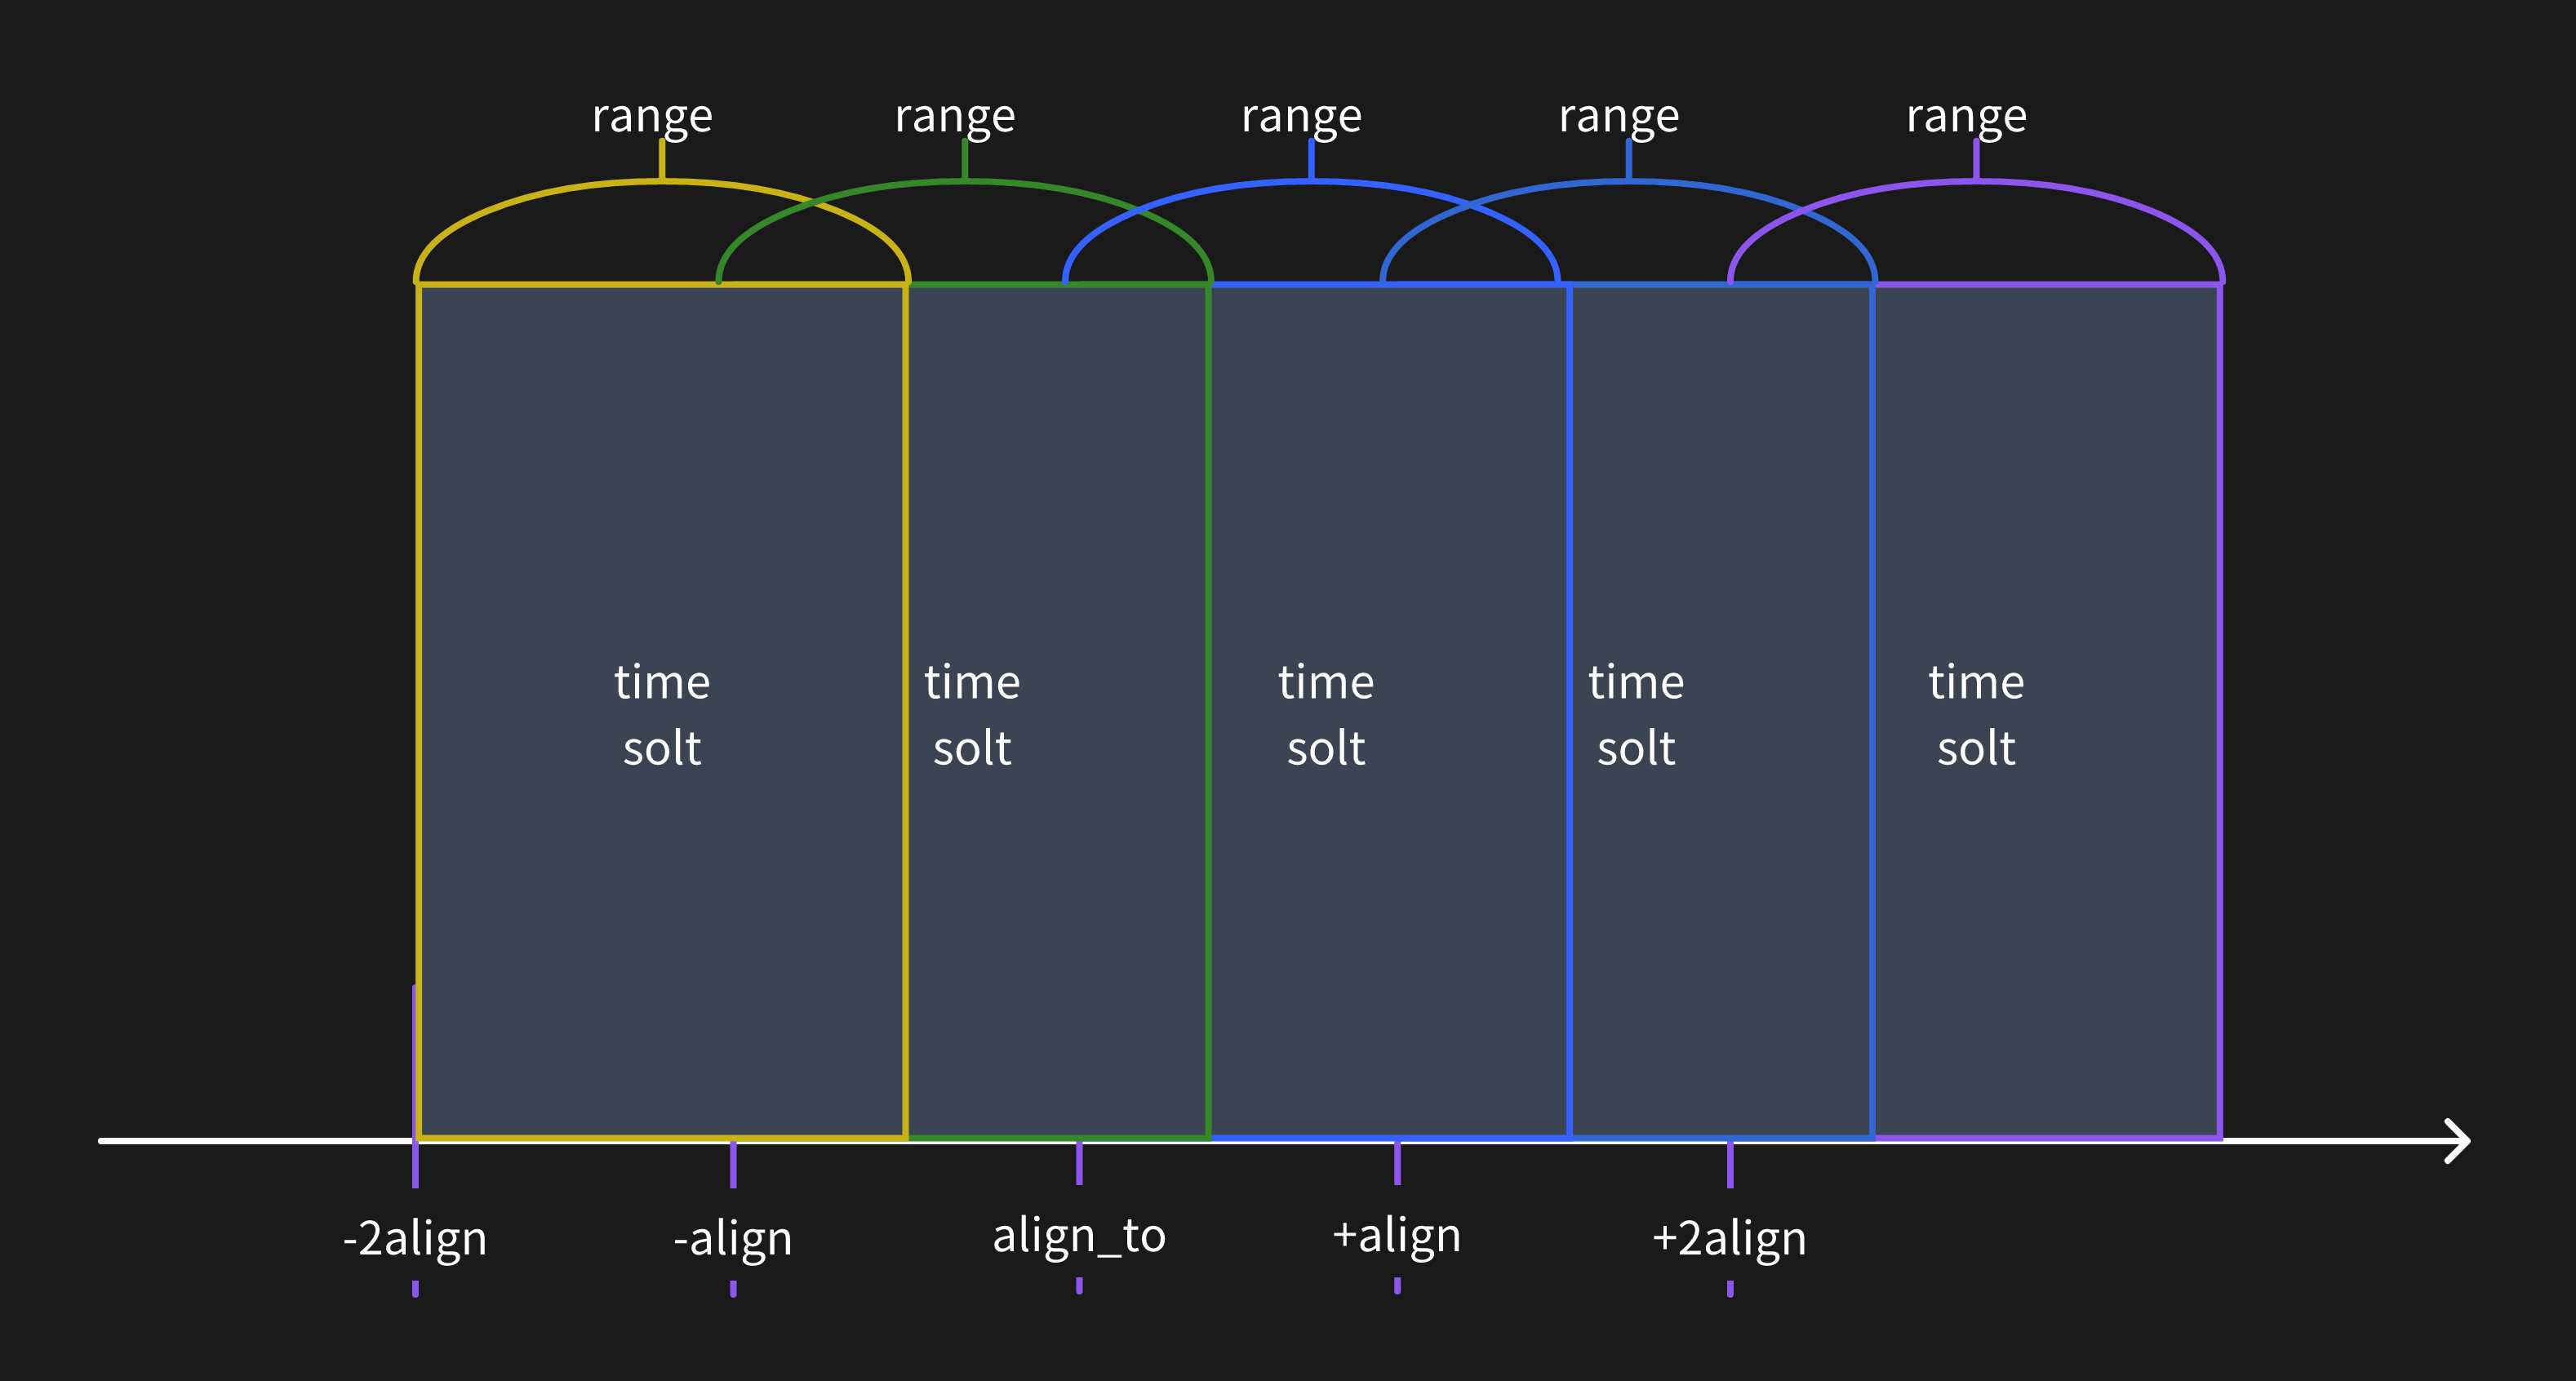
The following images can help you understand the time range window more visually:
When the query resolution is greater than the time range window, the metrics data will be calculated for only one time range window.
When the query resolution is less than the time range window, the metrics data will be calculated for multiple time range windows.
Align to specific timestamp
You can change the origin alignment time to any timestamp you want. For example, use NOW to align to the current time:
SELECT
    ts,
    host,
    avg(cpu) RANGE '1w'
FROM monitor
ALIGN '1d' TO NOW BY (host);
SELECT
ts,
host,
avg(cpu) RANGE '1w'
FROM monitor
ALIGN '1d' TO NOW BY (host);Or use a ISO 8601 timestamp to align to a specified time:
SELECT
    ts,
    host,
    avg(cpu) RANGE '1w'
FROM monitor
ALIGN '1d' TO '2023-12-01T00:00:00+08:00' BY (host);
SELECT
ts,
host,
avg(cpu) RANGE '1w'
FROM monitor
ALIGN '1d' TO '2023-12-01T00:00:00+08:00' BY (host);Fill null values
The FILL option can be used to fill null values in the data. In the above example, the LINEAR method is used to fill null values. Other methods are also supported, such as PREV and a constant value X. For more information, please refer to the FILL OPTION.
Syntax
Please refer to Range Query for more information.
HTTP API
Use POST method to query data:
curl -X POST \
  -H 'authorization: Basic {{authorization if exists}}' \
  -H 'Content-Type: application/x-www-form-urlencoded' \
  -d 'sql=select * from monitor' \
http://localhost:4000/v1/sql?db=public
curl -X POST \
-H 'authorization: Basic {{authorization if exists}}' \
-H 'Content-Type: application/x-www-form-urlencoded' \
-d 'sql=select * from monitor' \
http://localhost:4000/v1/sql?db=publicThe result is shown below:
{
  "code": 0,
  "output": [
    {
      "records": {
        "schema": {
          "column_schemas": [
            {
              "name": "host",
              "data_type": "String"
            },
            {
              "name": "ts",
              "data_type": "TimestampMillisecond"
            },
            {
              "name": "cpu",
              "data_type": "Float64"
            },
            {
              "name": "memory",
              "data_type": "Float64"
            }
          ]
        },
        "rows": [
          ["127.0.0.1", 1667446797450, 0.1, 0.4],
          ["127.0.0.1", 1667446798450, 0.5, 0.2],
          ["127.0.0.2", 1667446798450, 0.2, 0.3]
        ]
      }
    }
  ],
  "execution_time_ms": 0
}
{
"code": 0,
"output": [
{
"records": {
"schema": {
"column_schemas": [
{
"name": "host",
"data_type": "String"
},
{
"name": "ts",
"data_type": "TimestampMillisecond"
},
{
"name": "cpu",
"data_type": "Float64"
},
{
"name": "memory",
"data_type": "Float64"
}
]
},
"rows": [
["127.0.0.1", 1667446797450, 0.1, 0.4],
["127.0.0.1", 1667446798450, 0.5, 0.2],
["127.0.0.2", 1667446798450, 0.2, 0.3]
]
}
}
],
"execution_time_ms": 0
}For more information about SQL HTTP request, please refer to API document.