Why GreptimeDB
The Problem: Three Systems for Three Signals
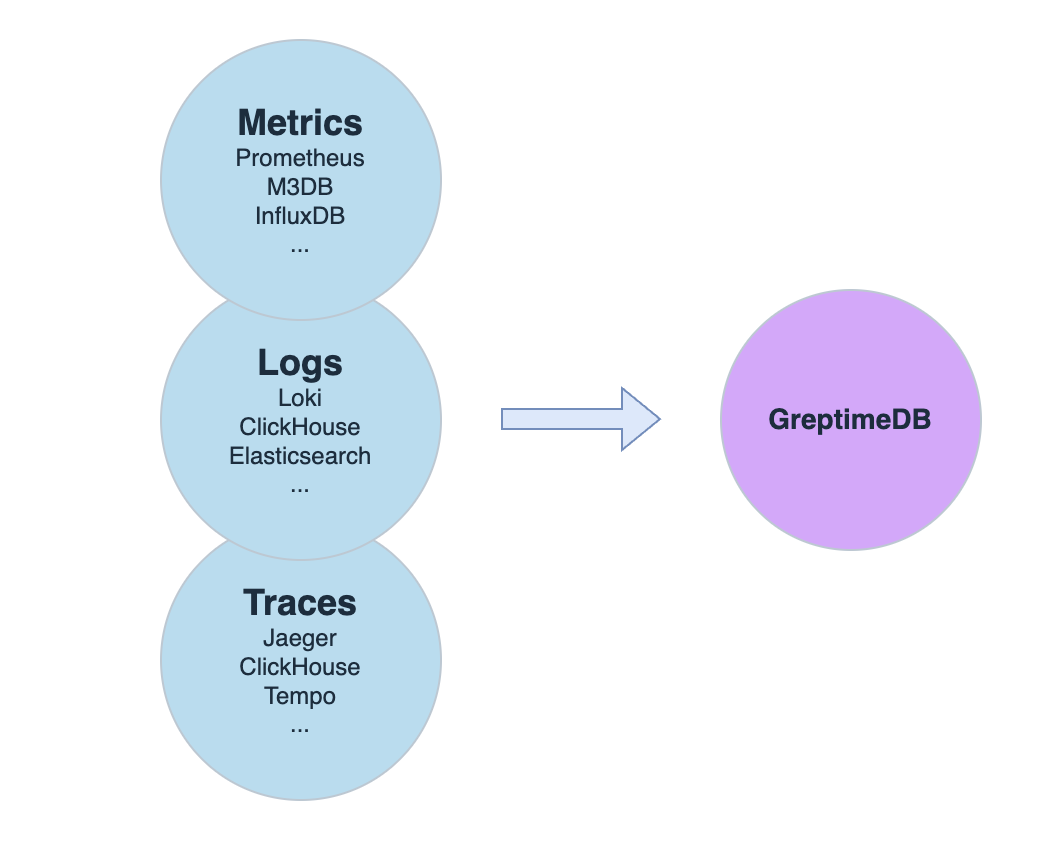
Most observability stacks today look like this: Prometheus (or Thanos/Mimir) for metrics, Grafana Loki (or ELK) for logs, and Elasticsearch (or Tempo) for traces. Each system has its own query language, storage backend, scaling model, and operational overhead.
This "three pillars" architecture made sense when these were separate concerns. But in practice, it means:
- 3x operational complexity — three systems to deploy, monitor, upgrade, and debug
- Data silos — correlating a spike in error logs with a metrics anomaly requires manual context-switching between systems
- Cost escalation — each system stores redundant metadata, and scaling each independently leads to over-provisioning
GreptimeDB takes a different approach: one database engine for all three signal types, built on object storage with compute-storage separation.
Unified Processing for Observability Data
GreptimeDB unifies the processing of metrics, logs, and traces through:
- A consistent data model that treats all observability data as timestamped wide events with context
- Native support for both SQL and PromQL queries
- Built-in continuous aggregation capabilities (Flow) for real-time aggregation and analytics
- Seamless correlation analysis across different types of observability data (read the SQL example for detailed info)
It replaces complex legacy data stacks with a high-performance single solution.
This means you can replace the Prometheus + Loki + Elasticsearch stack with a single database, and use SQL to correlate metrics spikes with log patterns and trace latency — in one query, without context-switching between systems.
Cost-Effective with Object Storage
GreptimeDB leverages cloud object storage (like AWS S3 and Azure Blob Storage etc.) as its storage layer, dramatically reducing costs compared to traditional storage solutions. Its optimized columnar storage and advanced compression algorithms achieve up to 50x cost efficiency. Scale flexibly across cloud storage systems (e.g., S3, Azure Blob Storage) for simplified management, dramatic cost efficiency, and no vendor lock-in.
In production deployments, teams have achieved:
- Logs: 60%+ storage cost reduction in production at OceanBase Cloud (migrated from Loki — 80+ GreptimeDB clusters, 300TB of multi-cloud logs and SQL audit data)
- Traces: 45x storage cost reduction, 3x faster queries (replaced Elasticsearch as Jaeger backend — one-week migration)
- Metrics: Replaced Thanos with native compute-storage separation, significantly reducing operational complexity
High Performance
As for performance optimization, GreptimeDB utilizes different techniques such as LSM Tree, data sharding, and flexible WAL options (local disk or distributed services like Kafka), to handle large workloads of observability data ingestion.
GreptimeDB is written in pure Rust for superior performance and reliability. The powerful and fast query engine is powered by vectorized execution and distributed parallel processing (thanks to Apache DataFusion), and combined with indexing capabilities such as inverted index, skipping index, and full-text index. GreptimeDB combines smart indexing and Massively Parallel Processing (MPP) to boost pruning and filtering.
GreptimeDB achieves 1 billion cold runs #1 in JSONBench! Read more benchmark reports.
Elastic Scaling with Kubernetes
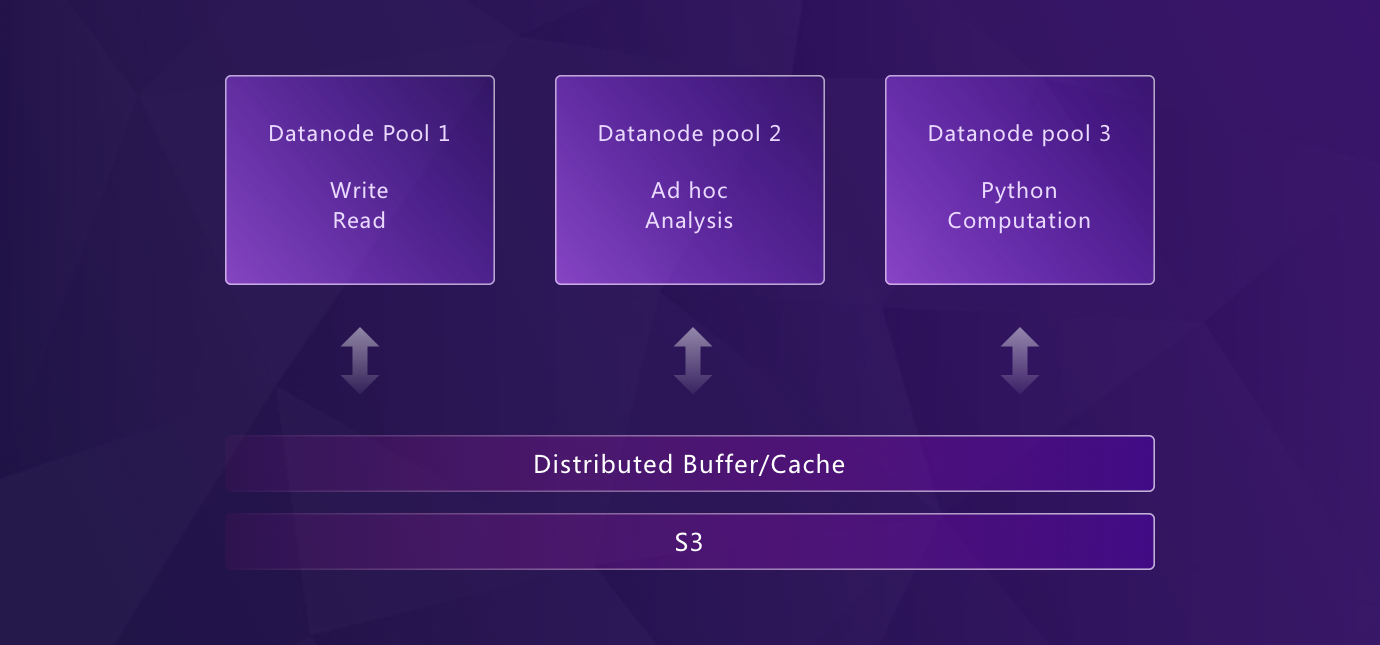
Built from the ground up for Kubernetes, GreptimeDB features a disaggregated storage and compute architecture that enables true elastic scaling:
- Independent scaling of storage and compute resources
- Unlimited horizontal scalability through Kubernetes
- Resource isolation between different workloads (ingestion, querying, compaction)
- Automatic failover and high availability
Unlike Thanos or Mimir, which require multiple stateful components (ingesters with persistent disks, store-gateways, compactors) to achieve scalability, GreptimeDB's architecture separates compute from storage at the core — data persists in object storage, compute nodes scale independently, with local disk serving as buffer/cache. WAL can be configured flexibly (local or distributed via Kafka). Scaling up means adding nodes; scaling down loses no data.
Flexible Architecture: From Edge to Cloud
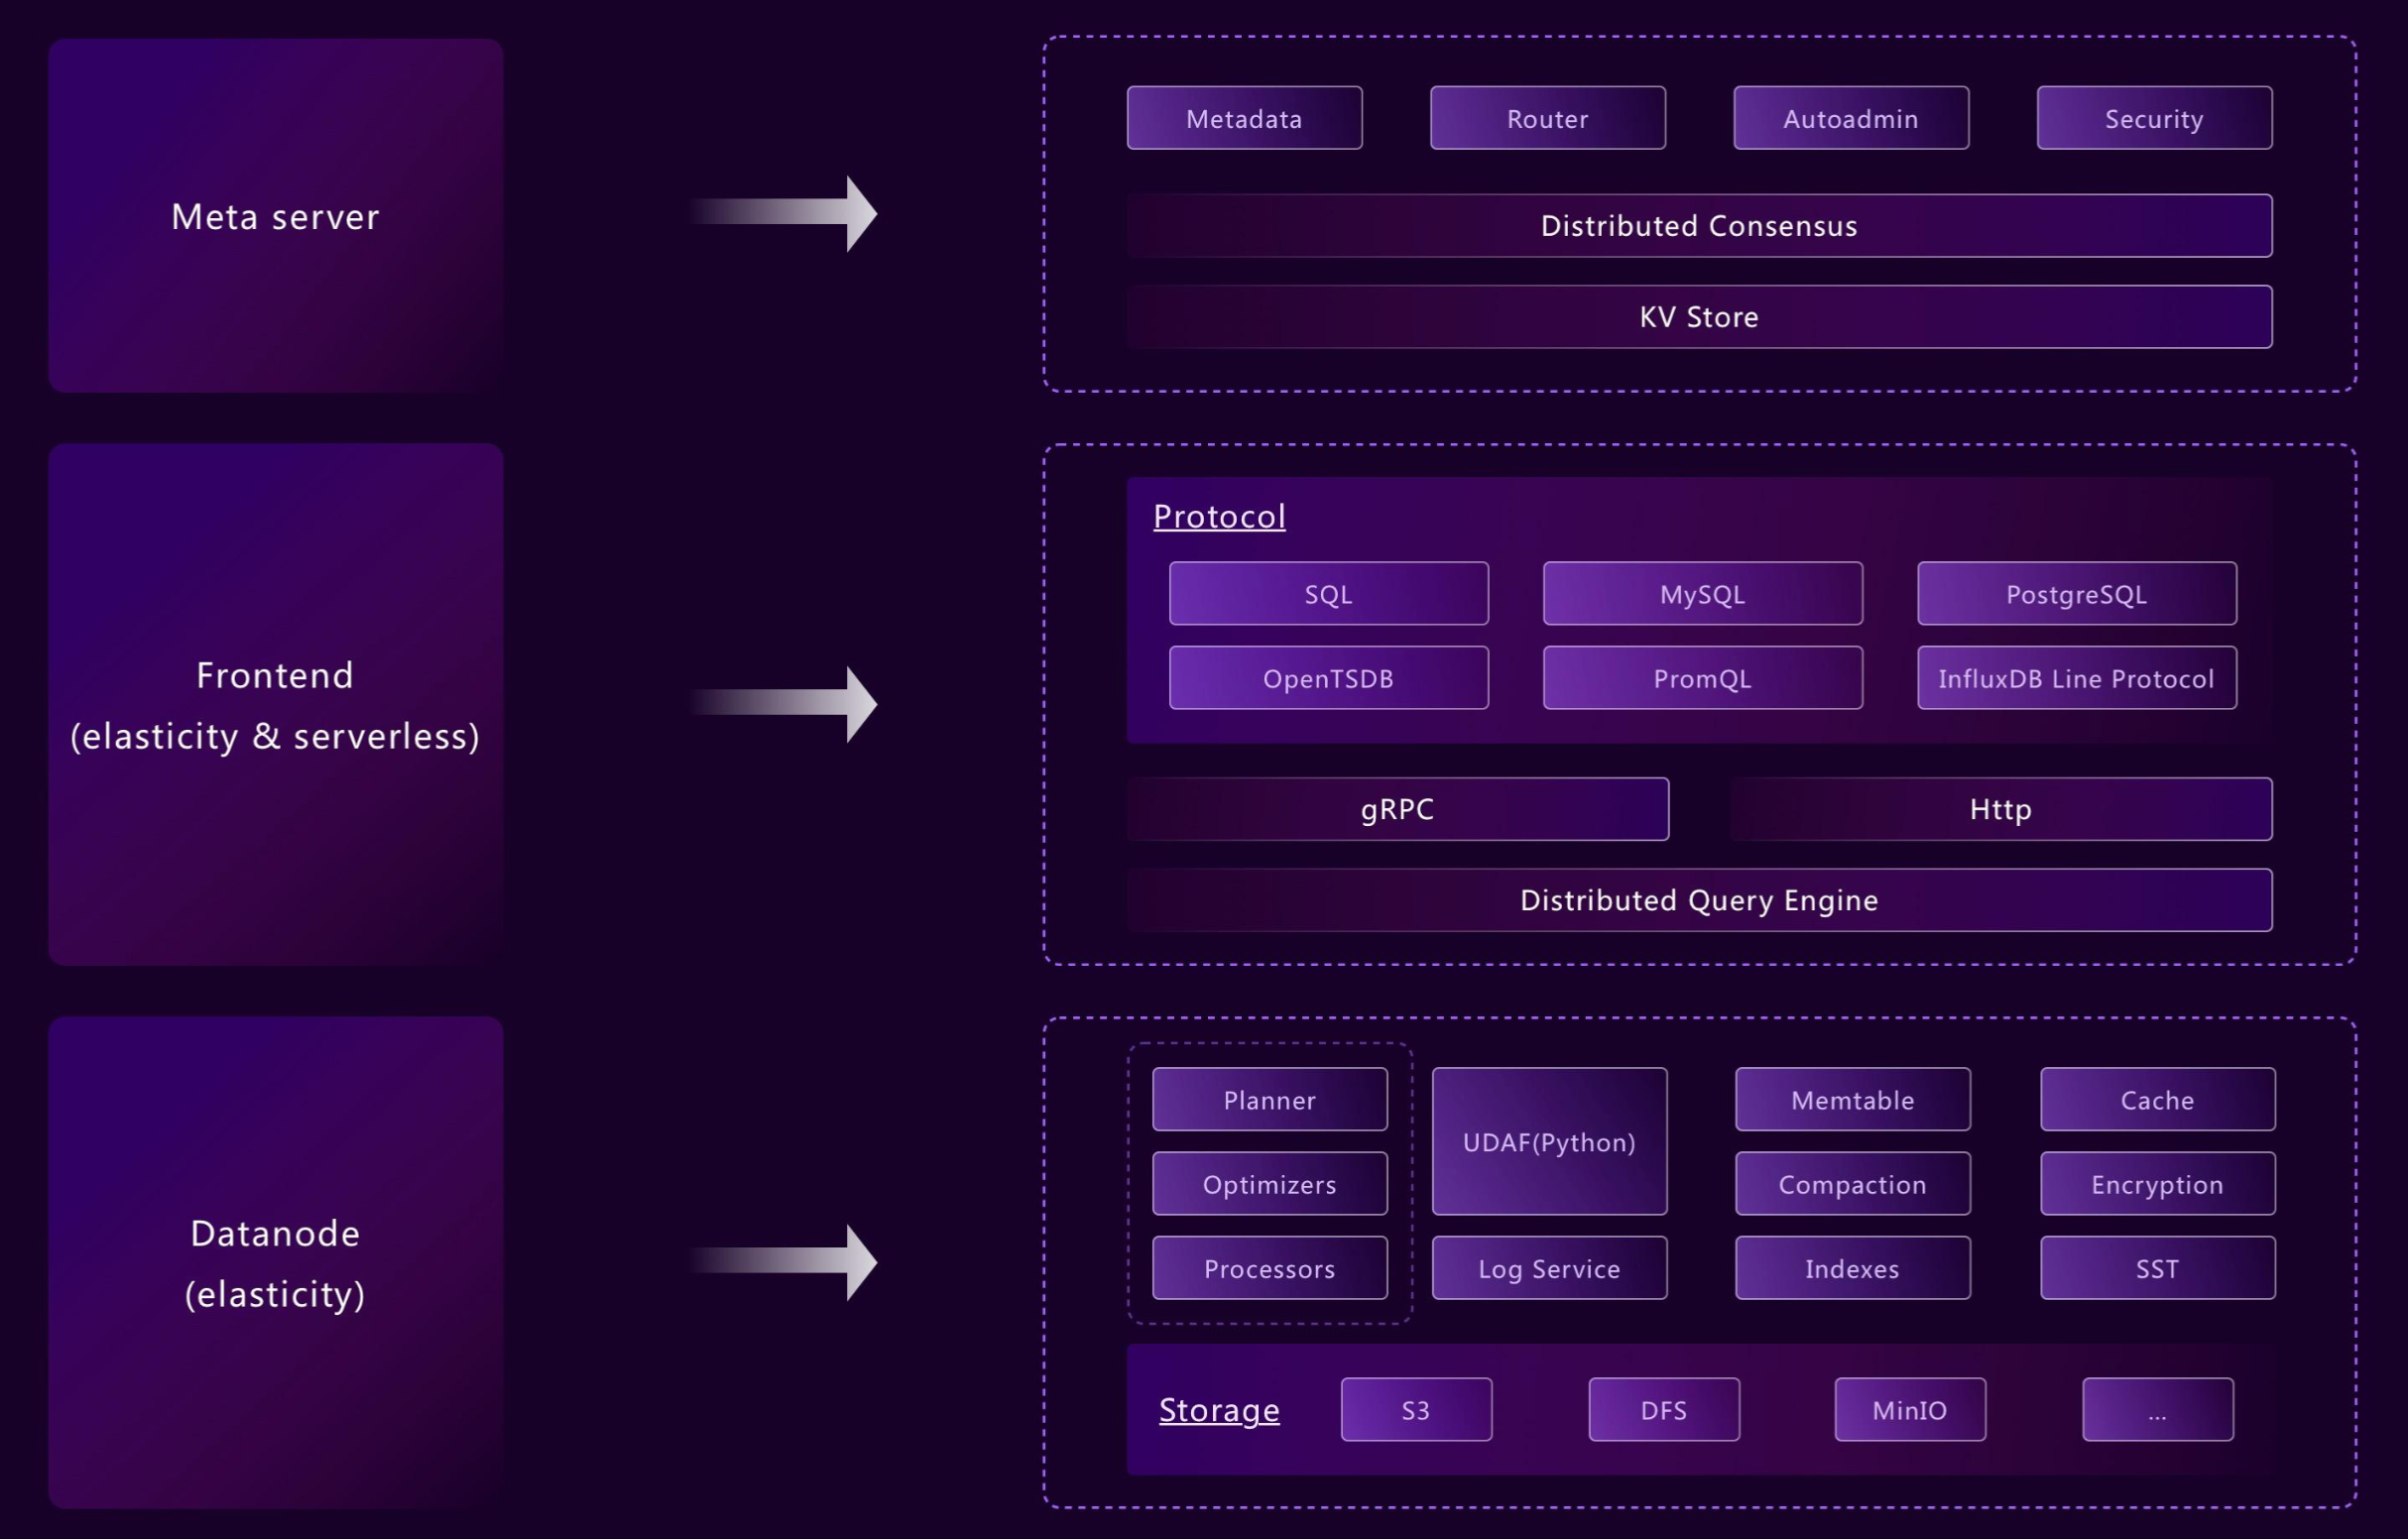
GreptimeDB's modularized architecture allows different components to operate independently or in unison as needed. Its flexible design supports a wide variety of deployment scenarios, from edge devices to cloud environments, while still using consistent APIs for operations. For example:
- Frontend, datanode, and metasrv can be merged into a standalone binary
- Components like WAL or indexing can be enabled or disabled per table
This flexibility ensures that GreptimeDB meets deployment requirements for edge-to-cloud solutions, like the Edge-Cloud Integrated Solution.
From embedded and standalone deployments to cloud-native clusters, GreptimeDB adapts to various environments easily.
Easy to Integrate
GreptimeDB supports PromQL, Prometheus remote write, OpenTelemetry, Jaeger, Loki, Elasticsearch, MySQL, and PostgreSQL protocols — migrate from your existing stack without rewriting queries or pipelines. Query with SQL or PromQL, visualize with Grafana.
The combination of SQL and PromQL means GreptimeDB can replace the classic "Prometheus + data warehouse" combo — use PromQL for real-time monitoring and alerting, SQL for deep analytics, joins, and aggregations, all in one system. GreptimeDB also supports a multi-value model, where a single row can contain multiple field columns, reducing transfer traffic and simplifying queries compared to single-value models.
Beyond querying, SQL is also GreptimeDB's management interface — create tables, manage schemas, set TTL policies, and configure indexes, all through standard SQL. No proprietary config files, no custom APIs, no YAML-driven control planes. This is a key operational difference from systems like Prometheus (configured via YAML + relabeling rules), Loki (LogQL + config files), or Elasticsearch (REST API + JSON mappings). Teams with SQL skills can manage GreptimeDB without learning new tooling.
How GreptimeDB Compares
The following comparison is based on general architectural characteristics and typical deployment scenarios:
| GreptimeDB | Prometheus / Thanos / Mimir | Grafana Loki | Elasticsearch | |
|---|---|---|---|---|
| Data types | Metrics, logs, traces | Metrics only | Logs only | Logs, traces |
| Query language | SQL + PromQL | PromQL | LogQL | Query DSL |
| Storage | Native object storage (S3, etc.) | Local disk + object storage (Thanos/Mimir), ingester requires persistent disk | Object storage (chunks) | Local disk |
| Scaling | Compute-storage separation, compute nodes scale independently | Federation / Thanos / Mimir — multi-component, ops heavy | Stateless + object storage | Shard-based, ops heavy |
| Cost efficiency | Up to 50x lower storage | High at scale | Moderate | High (inverted index overhead) |
| OpenTelemetry | Native (metrics + logs + traces) | Partial (metrics only) | Partial (logs only) | Via instrumentation |
| Management | Standard SQL (DDL, TTL, indexes) | YAML config + relabeling rules | YAML config + LogQL | REST API + JSON mappings |
For more details, explore:
- Observability 2.0 — Wide events, unified data model, and GreptimeDB's architecture for the next generation of observability
- Unified Storage for Observability - GreptimeDB's Approach — GreptimeDB's approach to unified storage
- Beyond Loki: Lightweight and Scalable Cloud-Native Log Monitoring