InfluxDB Line Protocol
In this section, we will collect system metric data, such as CPU and memory usage, and sends them to local GreptimeDB.
Prerequisites
Before trying GreptimeDB, we need to have GreptimeDB and Grafana installed and running locally.
- GreptimeDB is used for storing and querying data.
- Grafana is used for visualizing data.
Here we use Docker Compose to start GreptimeDB and Grafana. To do this, create a docker-compose.yml file with the following content:
services:
  grafana:
    image: grafana/grafana-oss:9.5.15
    container_name: grafana
    ports:
      - 127.0.0.1:3000:3000

  greptime:
    image: greptime/greptimedb:v0.9.0
    container_name: greptimedb
    ports:
      - 127.0.0.1:4000:4000
      - 127.0.0.1:4001:4001
      - 127.0.0.1:4002:4002
      - 127.0.0.1:4003:4003
    command: "standalone start --http-addr 0.0.0.0:4000 --rpc-addr 0.0.0.0:4001 --mysql-addr 0.0.0.0:4002 --postgres-addr 0.0.0.0:4003"
    volumes:
      - ./greptimedb:/tmp/greptimedb

networks: {}services:
grafana:
image: grafana/grafana-oss:9.5.15
container_name: grafana
ports:
- 127.0.0.1:3000:3000
greptime:
image: greptime/greptimedb:v0.9.0
container_name: greptimedb
ports:
- 127.0.0.1:4000:4000
- 127.0.0.1:4001:4001
- 127.0.0.1:4002:4002
- 127.0.0.1:4003:4003
command: "standalone start --http-addr 0.0.0.0:4000 --rpc-addr 0.0.0.0:4001 --mysql-addr 0.0.0.0:4002 --postgres-addr 0.0.0.0:4003"
volumes:
- ./greptimedb:/tmp/greptimedb
networks: {}Then run the following command:
docker-compose updocker-compose upNOTE
The following steps assume that you have followed the documentation above, which uses Docker Compose to install GreptimeDB and Grafana.
Once you've successfully started GreptimeDB, you can verify the database status using the following command:
curl http://127.0.0.1:4000/statuscurl http://127.0.0.1:4000/statusIf the database is running, you will see an output like the following:
{
  "source_time": "2024-05-30T07:59:52Z",
  "commit": "05751084e7bbfc5e646df7f51bb7c3e5cbf16d58",
  "branch": "HEAD",
  "rustc_version": "rustc 1.79.0-nightly (f9b161492 2024-04-19)",
  "hostname": "977898bbda4f",
  "version": "0.8.1"
}
{
"source_time": "2024-05-30T07:59:52Z",
"commit": "05751084e7bbfc5e646df7f51bb7c3e5cbf16d58",
"branch": "HEAD",
"rustc_version": "rustc 1.79.0-nightly (f9b161492 2024-04-19)",
"hostname": "977898bbda4f",
"version": "0.8.1"
}Write data
To quickly get started with InfluxDB line protocol, we can use Bash to collect system metrics, such as CPU and memory usage, and send it to GreptimeDB. The source code is available on GitHub.
curl -L https://raw.githubusercontent.com/GreptimeCloudStarters/quick-start-influxdb-line-protocol/main/quick-start.sh | bash -s -- -e http://localhost:4000/v1/influxdb/writecurl -L https://raw.githubusercontent.com/GreptimeCloudStarters/quick-start-influxdb-line-protocol/main/quick-start.sh | bash -s -- -e http://localhost:4000/v1/influxdb/writeVisualize Data with Grafana
Add Data Source
You can access Grafana at http://localhost:3000.
Use admin as both the username and password to log in.
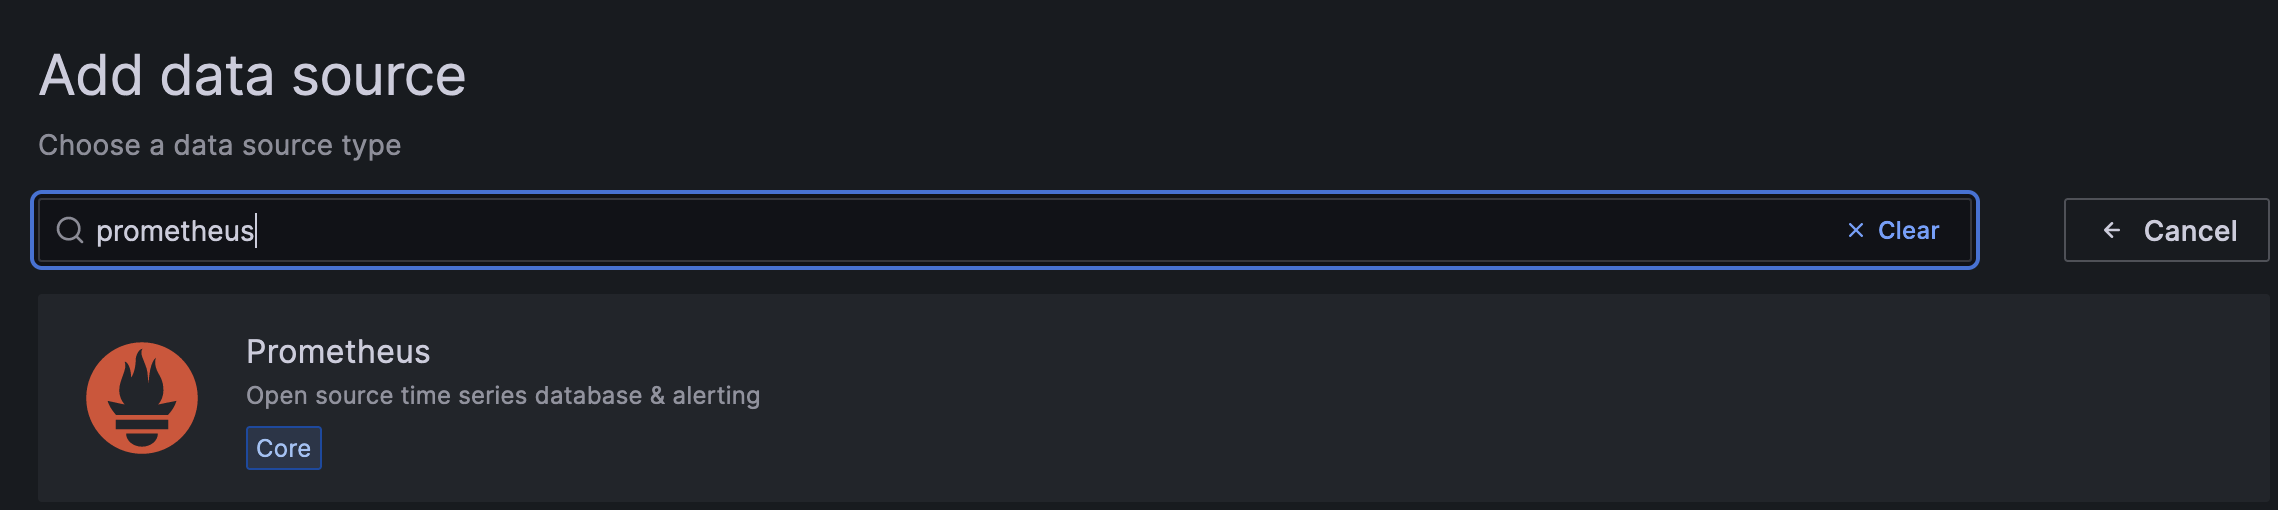
GreptimeDB can be configured as a Prometheus data source in Grafana.
Click the Add data source button and select Prometheus as the type.
Fill in the following information:
- Name:
GreptimeDB - Prometheus server URL in HTTP:
http://greptimedb:4000/v1/prometheus - Custom HTTP headers: Click "Add header" and fill in the header
x-greptime-db-namewith the valuepublic, which is the name of the database.
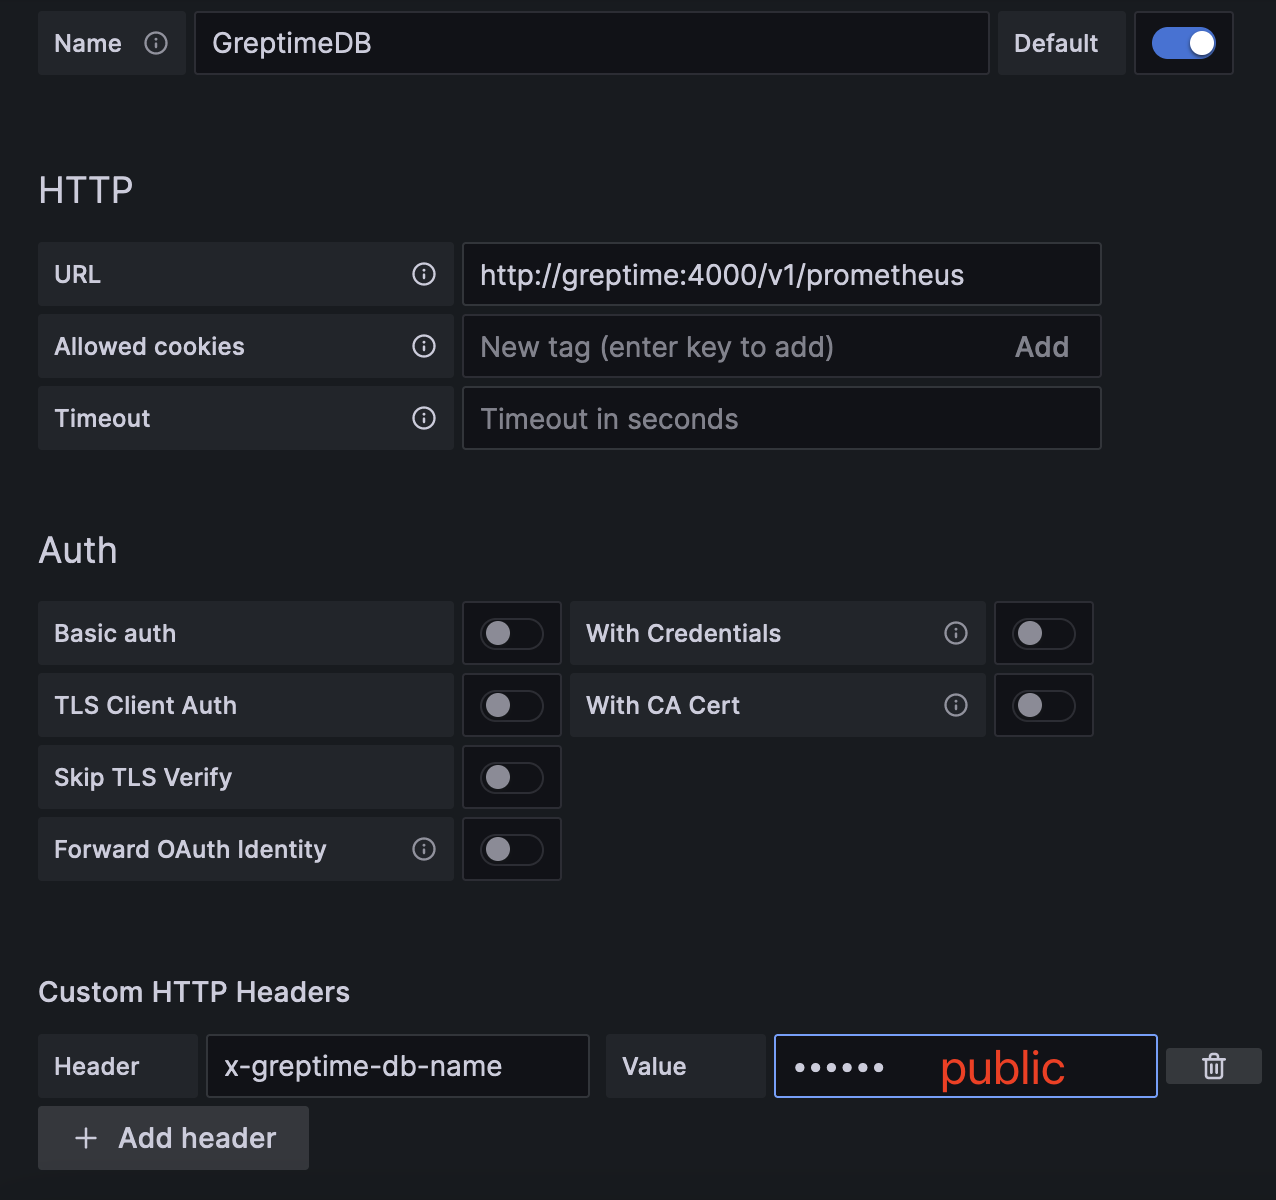
Then click Save & Test button to test the connection.
For more information on using Prometheus as a data source for GreptimeDB, please refer to Grafana-Prometheus.
Create a Dashboard
To create a new dashboard in Grafana, click the Create your first dashboard button on the home page.
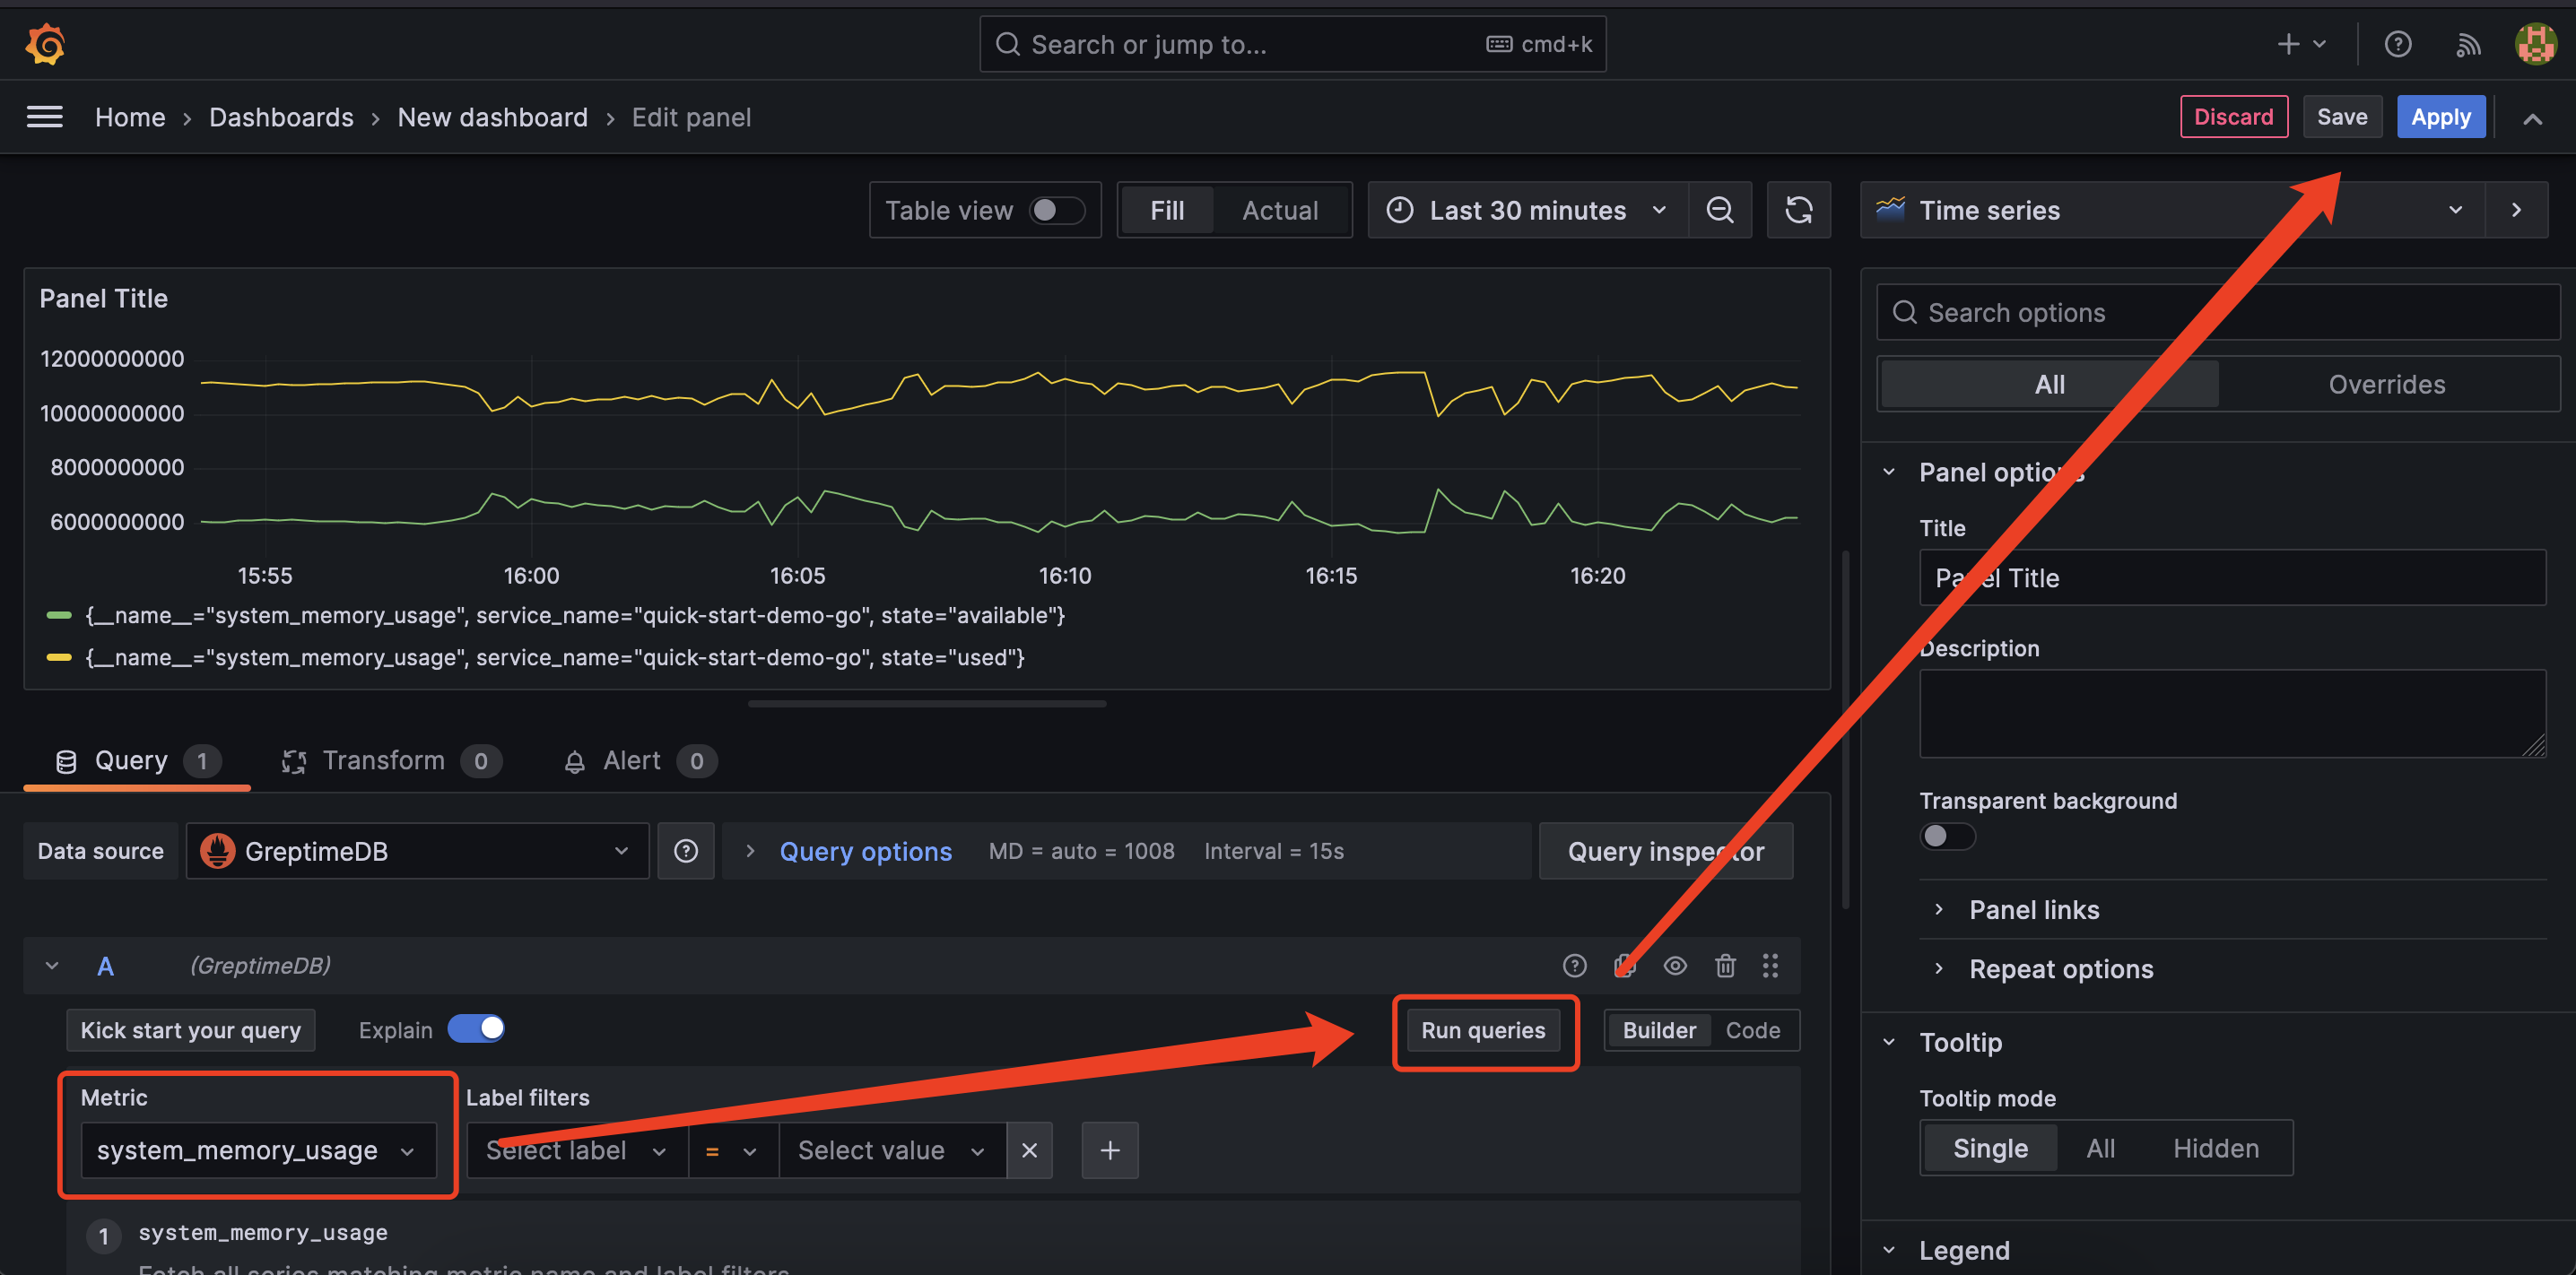
Then, click Add visualization and select GreptimeDB as the data source.
To view the metric data on the panel page,
select a metric from the Metric drop-down list in the Query tab, and then click Run query.
Once you have reviewed the data, click Save to save the panel.
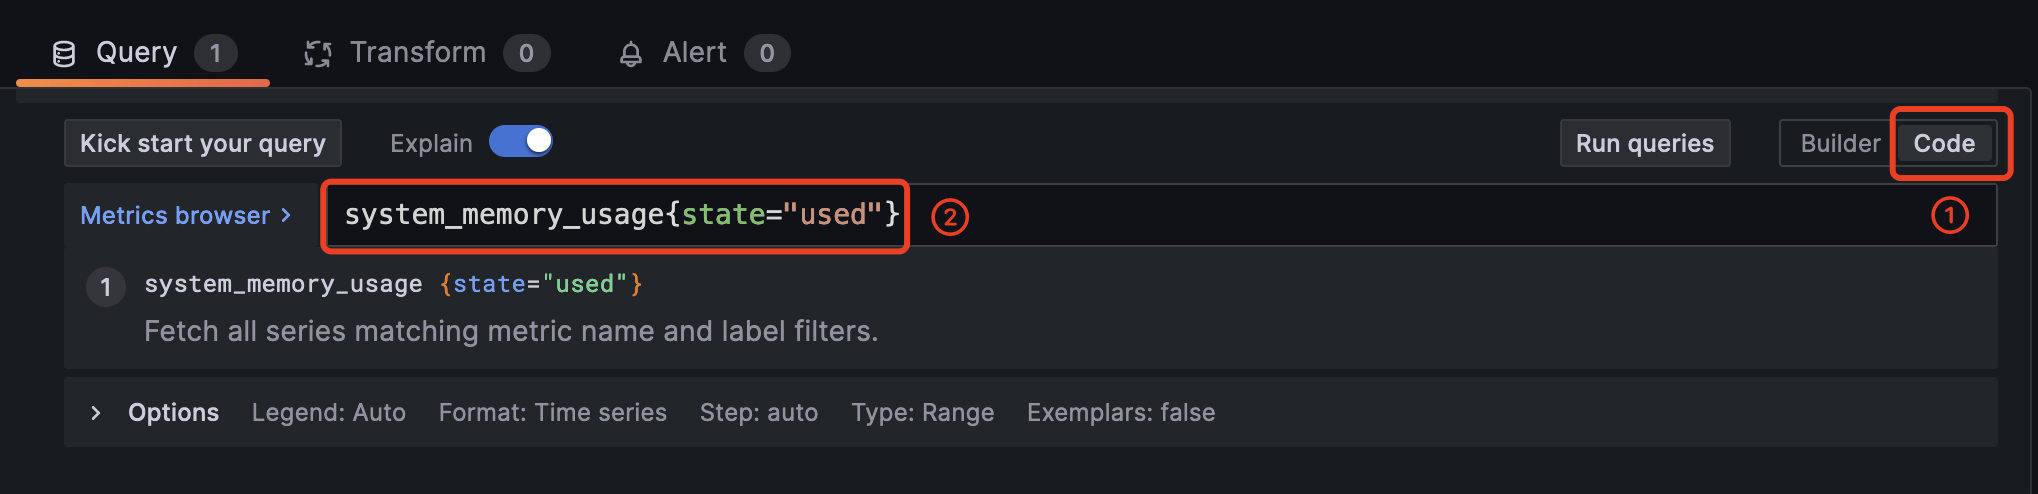
You can also use PromQL to create panels.
Click the code button on the right side of the Query tab to switch to the PromQL editor.
Then, enter a PromQL statement, such as system_memory_usage{state="used"},
and click Run query to view the metric data.
NOTE
GreptimeDB is compatible with most of PromQL, but there are some limitations. Please refer to the PromQL Limitations documentation for more information.
Next Steps
Congratulations on quickly experiencing the basic features of GreptimeDB! Now, you can explore more of GreptimeDB's features by visiting the User Guide documentation.