MySQL
Prerequisites
Before trying GreptimeDB, we need to have GreptimeDB and Grafana installed and running locally.
- GreptimeDB is used for storing and querying data.
- Grafana is used for visualizing data.
Here we use Docker Compose to start GreptimeDB and Grafana. To do this, create a docker-compose.yml file with the following content:
services:
  grafana:
    image: grafana/grafana-oss:9.5.15
    container_name: grafana
    ports:
      - 127.0.0.1:3000:3000

  greptime:
    image: greptime/greptimedb:v0.9.0
    container_name: greptimedb
    ports:
      - 127.0.0.1:4000:4000
      - 127.0.0.1:4001:4001
      - 127.0.0.1:4002:4002
      - 127.0.0.1:4003:4003
    command: "standalone start --http-addr 0.0.0.0:4000 --rpc-addr 0.0.0.0:4001 --mysql-addr 0.0.0.0:4002 --postgres-addr 0.0.0.0:4003"
    volumes:
      - ./greptimedb:/tmp/greptimedb

networks: {}services:
grafana:
image: grafana/grafana-oss:9.5.15
container_name: grafana
ports:
- 127.0.0.1:3000:3000
greptime:
image: greptime/greptimedb:v0.9.0
container_name: greptimedb
ports:
- 127.0.0.1:4000:4000
- 127.0.0.1:4001:4001
- 127.0.0.1:4002:4002
- 127.0.0.1:4003:4003
command: "standalone start --http-addr 0.0.0.0:4000 --rpc-addr 0.0.0.0:4001 --mysql-addr 0.0.0.0:4002 --postgres-addr 0.0.0.0:4003"
volumes:
- ./greptimedb:/tmp/greptimedb
networks: {}Then run the following command:
docker-compose updocker-compose upNOTE
The following steps assume that you have followed the documentation above, which uses Docker Compose to install GreptimeDB and Grafana.
Once you've successfully started GreptimeDB, you can verify the database status using the following command:
curl http://127.0.0.1:4000/statuscurl http://127.0.0.1:4000/statusIf the database is running, you will see an output like the following:
{
  "source_time": "2024-05-30T07:59:52Z",
  "commit": "05751084e7bbfc5e646df7f51bb7c3e5cbf16d58",
  "branch": "HEAD",
  "rustc_version": "rustc 1.79.0-nightly (f9b161492 2024-04-19)",
  "hostname": "977898bbda4f",
  "version": "0.8.1"
}
{
"source_time": "2024-05-30T07:59:52Z",
"commit": "05751084e7bbfc5e646df7f51bb7c3e5cbf16d58",
"branch": "HEAD",
"rustc_version": "rustc 1.79.0-nightly (f9b161492 2024-04-19)",
"hostname": "977898bbda4f",
"version": "0.8.1"
}Try Out Basic SQL Operations
Connect
mysql -h 127.0.0.1 -P 4002mysql -h 127.0.0.1 -P 4002Also, you can use PostgreSQL to connect the database:
psql -h 127.0.0.1 -p 4003 -d publicpsql -h 127.0.0.1 -p 4003 -d publicCreate table
Note: GreptimeDB offers a schemaless approach to writing data that eliminates the need to manually create tables using additional protocols. See Automatic Schema Generation.
Now we create a table via MySQL. Let's start by creating the system_metrics table which contains system resource metrics, including CPU/memory/disk usage. The data is scraped every 5 seconds.
CREATE TABLE IF NOT EXISTS system_metrics (
    host STRING,
    idc STRING,
    cpu_util DOUBLE,
    memory_util DOUBLE,
    disk_util DOUBLE,
    ts TIMESTAMP DEFAULT CURRENT_TIMESTAMP,
    PRIMARY KEY(host, idc),
    TIME INDEX(ts)
);
CREATE TABLE IF NOT EXISTS system_metrics (
host STRING,
idc STRING,
cpu_util DOUBLE,
memory_util DOUBLE,
disk_util DOUBLE,
ts TIMESTAMP DEFAULT CURRENT_TIMESTAMP,
PRIMARY KEY(host, idc),
TIME INDEX(ts)
);Field descriptions:
| Field | Type | Description |
|---|---|---|
| host | string | The hostname |
| idc | string | The idc name where the host belongs to |
| cpu_util | double | The percent use of CPU |
| memory_util | double | The percent use of memory |
| disk_util | double | The percent use of disks |
| ts | timestamp | Timestamp column incrementing |
- The table can be created automatically if you are using other protocols. See Create Table.
- For more information about creating table SQL, please refer to CREATE.
- For data types, please check data types.
Insert data
Using the INSERT statement is an easy way to add data to your table. The following statement allows us to insert several rows into the system_metrics table.
INSERT INTO system_metrics
VALUES
    ("host1", "idc_a", 11.8, 10.3, 10.3, 1667446797450),
    ("host1", "idc_a", 80.1, 70.3, 90.0, 1667446797550),
    ("host1", "idc_b", 50.0, 66.7, 40.6, 1667446797650),
    ("host1", "idc_b", 51.0, 66.5, 39.6, 1667446797750),
    ("host1", "idc_b", 52.0, 66.9, 70.6, 1667446797850),
    ("host1", "idc_b", 53.0, 63.0, 50.6, 1667446797950),
    ("host1", "idc_b", 78.0, 66.7, 20.6, 1667446798050),
    ("host1", "idc_b", 68.0, 63.9, 50.6, 1667446798150),
    ("host1", "idc_b", 90.0, 39.9, 60.6, 1667446798250);
INSERT INTO system_metrics
VALUES
("host1", "idc_a", 11.8, 10.3, 10.3, 1667446797450),
("host1", "idc_a", 80.1, 70.3, 90.0, 1667446797550),
("host1", "idc_b", 50.0, 66.7, 40.6, 1667446797650),
("host1", "idc_b", 51.0, 66.5, 39.6, 1667446797750),
("host1", "idc_b", 52.0, 66.9, 70.6, 1667446797850),
("host1", "idc_b", 53.0, 63.0, 50.6, 1667446797950),
("host1", "idc_b", 78.0, 66.7, 20.6, 1667446798050),
("host1", "idc_b", 68.0, 63.9, 50.6, 1667446798150),
("host1", "idc_b", 90.0, 39.9, 60.6, 1667446798250);For more information about the INSERT statement, please refer to INSERT.
Query data
To select all the data from the system_metrics table, use the SELECT statement:
SELECT * FROM system_metrics;SELECT * FROM system_metrics;The query result looks like the following:
+-------+-------+----------+-------------+-----------+---------------------+
| host  | idc   | cpu_util | memory_util | disk_util | ts                  |
+-------+-------+----------+-------------+-----------+---------------------+
| host1 | idc_a |     11.8 |        10.3 |      10.3 | 2022-11-03 03:39:57 |
| host1 | idc_a |     80.1 |        70.3 |        90 | 2022-11-03 03:39:57 |
| host1 | idc_b |       50 |        66.7 |      40.6 | 2022-11-03 03:39:57 |
| host1 | idc_b |       51 |        66.5 |      39.6 | 2022-11-03 03:39:57 |
| host1 | idc_b |       52 |        66.9 |      70.6 | 2022-11-03 03:39:57 |
| host1 | idc_b |       53 |          63 |      50.6 | 2022-11-03 03:39:57 |
| host1 | idc_b |       78 |        66.7 |      20.6 | 2022-11-03 03:39:58 |
| host1 | idc_b |       68 |        63.9 |      50.6 | 2022-11-03 03:39:58 |
| host1 | idc_b |       90 |        39.9 |      60.6 | 2022-11-03 03:39:58 |
+-------+-------+----------+-------------+-----------+---------------------+
9 rows in set (0.00 sec)
+-------+-------+----------+-------------+-----------+---------------------+
| host | idc | cpu_util | memory_util | disk_util | ts |
+-------+-------+----------+-------------+-----------+---------------------+
| host1 | idc_a | 11.8 | 10.3 | 10.3 | 2022-11-03 03:39:57 |
| host1 | idc_a | 80.1 | 70.3 | 90 | 2022-11-03 03:39:57 |
| host1 | idc_b | 50 | 66.7 | 40.6 | 2022-11-03 03:39:57 |
| host1 | idc_b | 51 | 66.5 | 39.6 | 2022-11-03 03:39:57 |
| host1 | idc_b | 52 | 66.9 | 70.6 | 2022-11-03 03:39:57 |
| host1 | idc_b | 53 | 63 | 50.6 | 2022-11-03 03:39:57 |
| host1 | idc_b | 78 | 66.7 | 20.6 | 2022-11-03 03:39:58 |
| host1 | idc_b | 68 | 63.9 | 50.6 | 2022-11-03 03:39:58 |
| host1 | idc_b | 90 | 39.9 | 60.6 | 2022-11-03 03:39:58 |
+-------+-------+----------+-------------+-----------+---------------------+
9 rows in set (0.00 sec)You can use the count() function to get the number of all rows in the table:
SELECT count(*) FROM system_metrics;SELECT count(*) FROM system_metrics;+-----------------+
| COUNT(UInt8(1)) |
+-----------------+
| 9 |
+-----------------++-----------------+
| COUNT(UInt8(1)) |
+-----------------+
| 9 |
+-----------------+The avg() function returns the average value of a certain field:
SELECT avg(cpu_util) FROM system_metrics;SELECT avg(cpu_util) FROM system_metrics;+------------------------------+
| AVG(system_metrics.cpu_util) |
+------------------------------+
| 59.32222222222222 |
+------------------------------++------------------------------+
| AVG(system_metrics.cpu_util) |
+------------------------------+
| 59.32222222222222 |
+------------------------------+You can use the GROUP BY clause to group rows that have the same values into summary rows. The average memory usage grouped by idc:
SELECT idc, avg(memory_util) FROM system_metrics GROUP BY idc;SELECT idc, avg(memory_util) FROM system_metrics GROUP BY idc;+-------+---------------------------------+
| idc | AVG(system_metrics.memory_util) |
+-------+---------------------------------+
| idc_a | 40.3 |
| idc_b | 61.942857142857136 |
+-------+---------------------------------+
2 rows in set (0.03 sec)+-------+---------------------------------+
| idc | AVG(system_metrics.memory_util) |
+-------+---------------------------------+
| idc_a | 40.3 |
| idc_b | 61.942857142857136 |
+-------+---------------------------------+
2 rows in set (0.03 sec)For more information about the SELECT statement, please refer to SELECT.
Collect Host Metrics
To quickly get started with MySQL, we can use Bash to collect system metrics, such as CPU and memory usage, and send it to GreptimeDB via MySQL CLI. The source code is available on GitHub.
If you have started GreptimeDB using the Prerequisites section, you can use the following command to write data:
curl -L \
   https://raw.githubusercontent.com/GreptimeCloudStarters/quick-start-mysql/main/quick-start.sh |\
   bash -s -- -h 127.0.0.1 -d public -s DISABLED -P 4002
curl -L \
https://raw.githubusercontent.com/GreptimeCloudStarters/quick-start-mysql/main/quick-start.sh |\
bash -s -- -h 127.0.0.1 -d public -s DISABLED -P 4002Visualize data
GreptimeDB Dashboard
GreptimeDB provides a user-friendly dashboard to assist users in exploring data. Once GreptimeDB is started as mentioned in the Prerequisites section, you can access the dashboard through the HTTP endpoint http://localhost:4000/dashboard.
Write SQL into the command text, then click Run All. We'll got all data in system_metrics table.
SELECT * FROM system_metrics;SELECT * FROM system_metrics;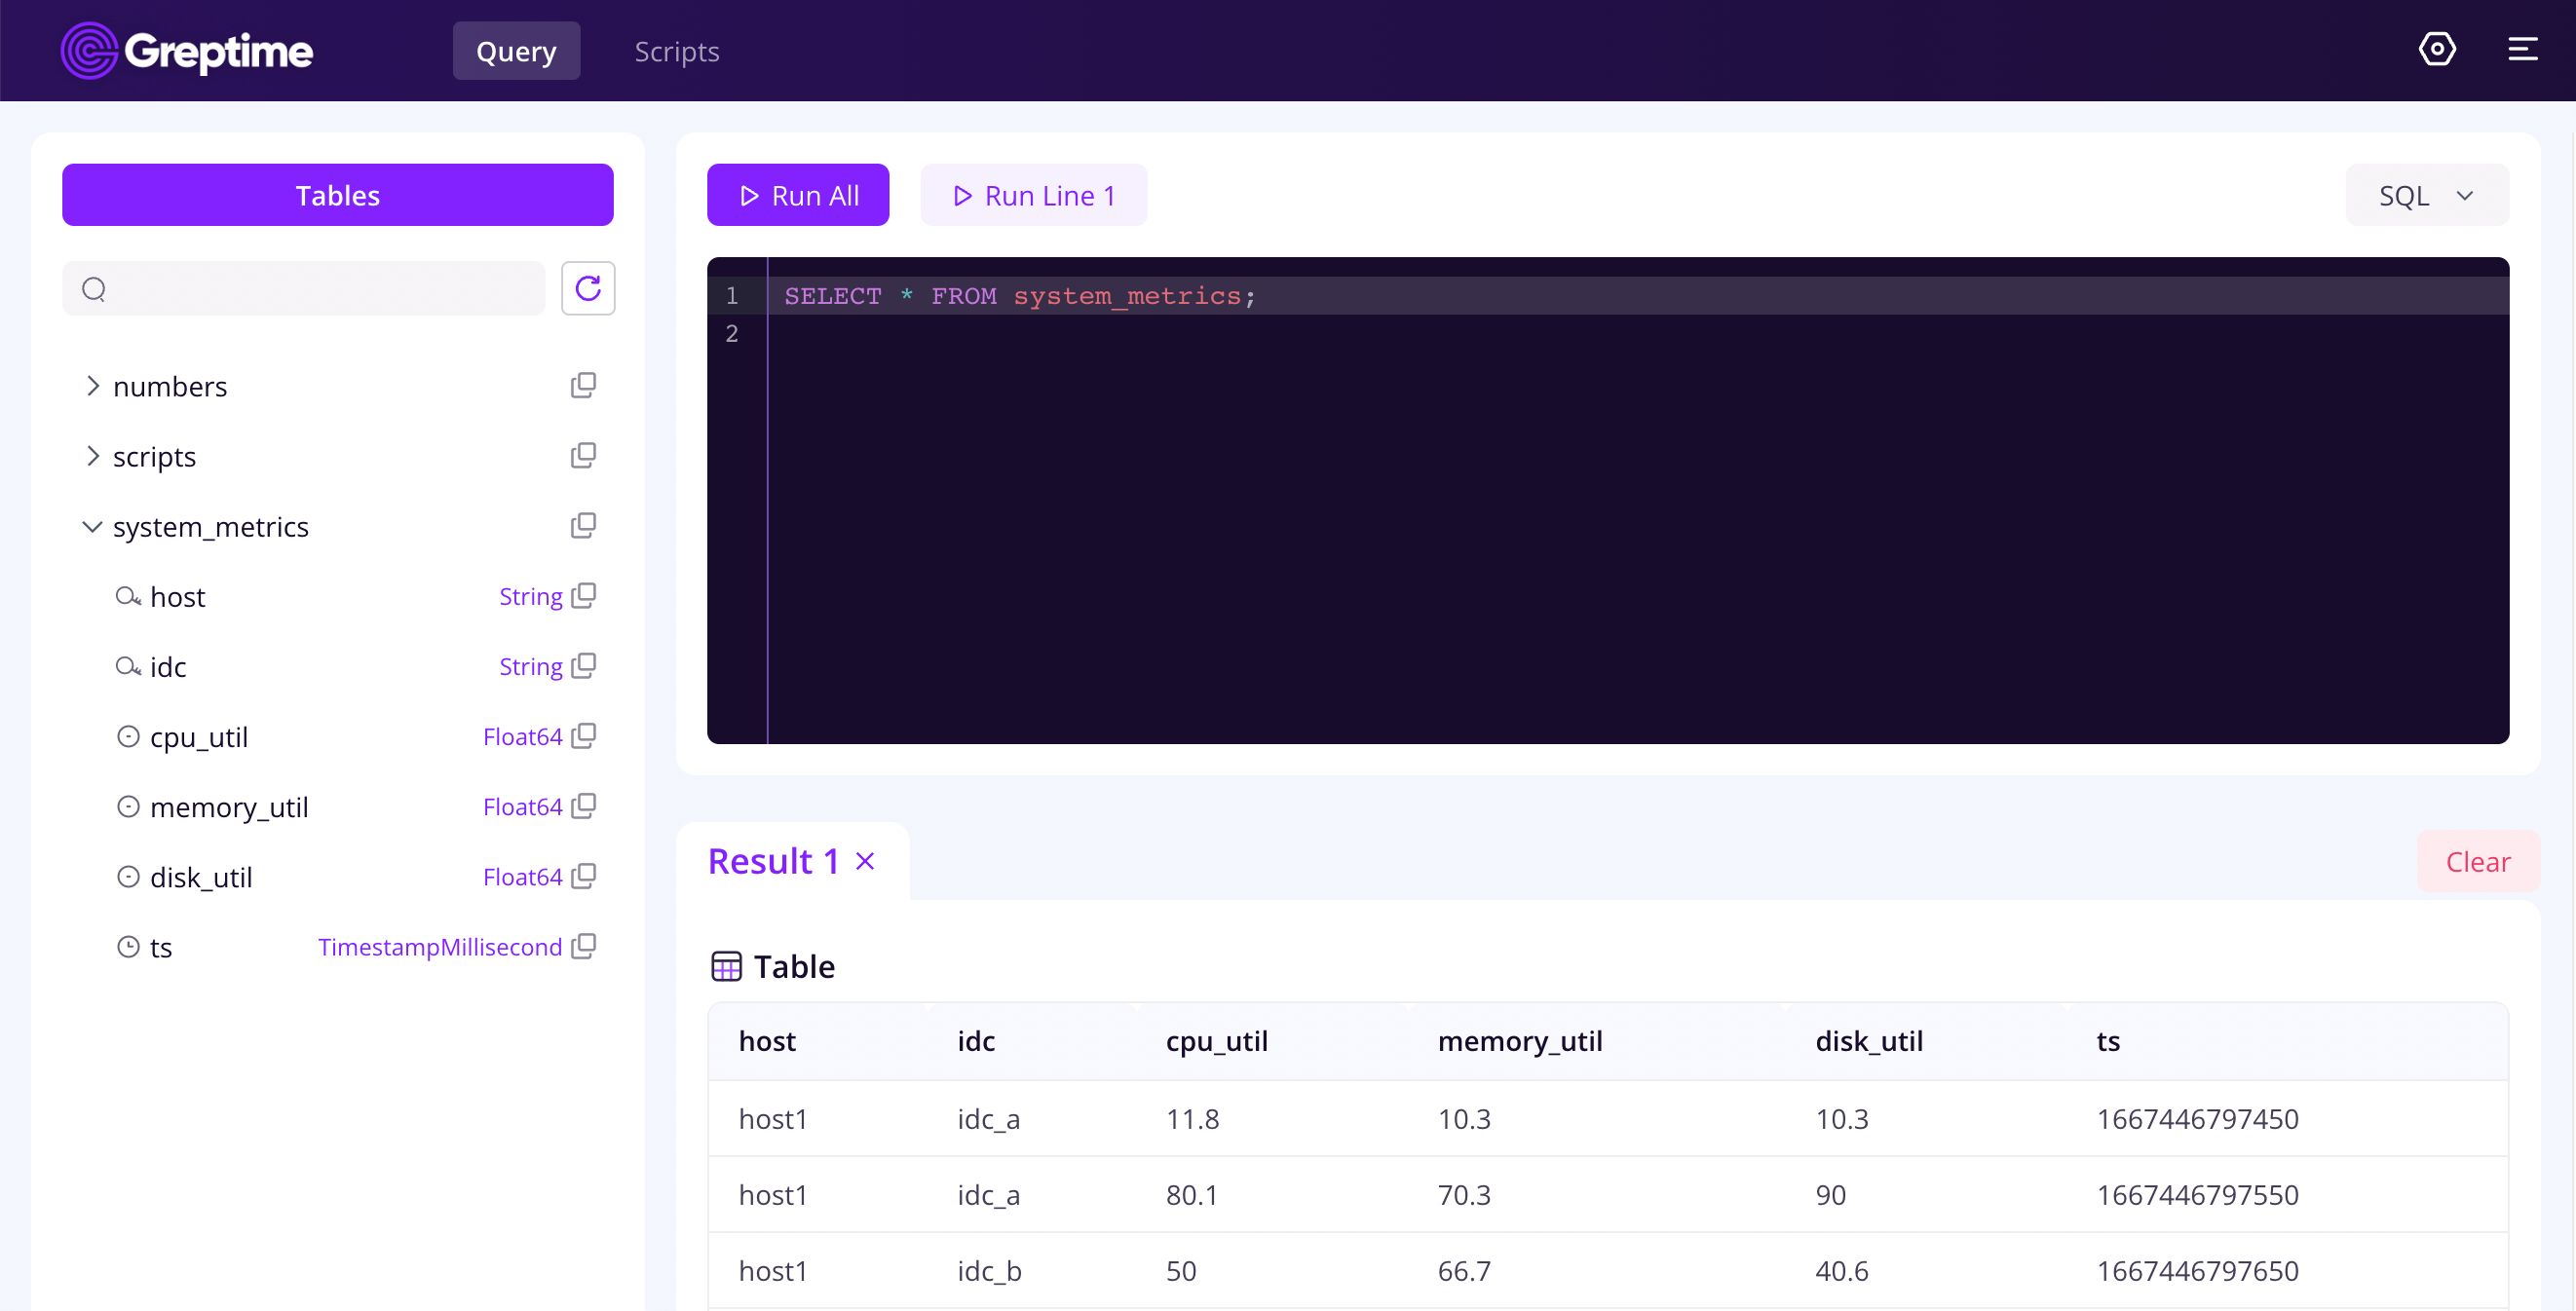
Grafana
Add Data Source
You can access Grafana at http://localhost:3000. Use admin as both the username and password to log in.
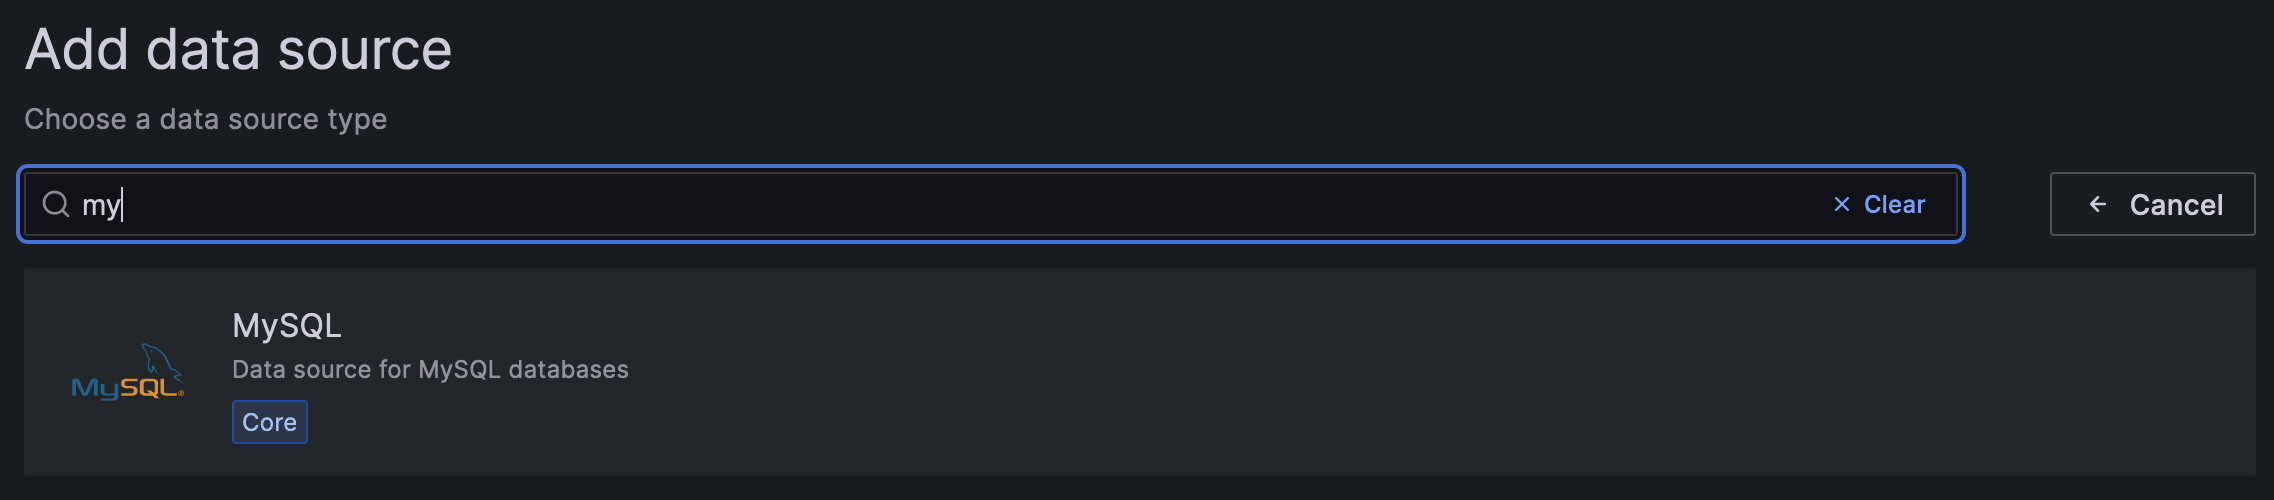
GreptimeDB can be configured as a MySQL data source in Grafana. Click the Add data source button and select MySQL as the type.
Fill in the following information:
- Name:
GreptimeDB - Host:
greptimedb:4002. The hostgreptimedbis the name of GreptimeDB container - Database:
public - SessionTimezone:
UTC
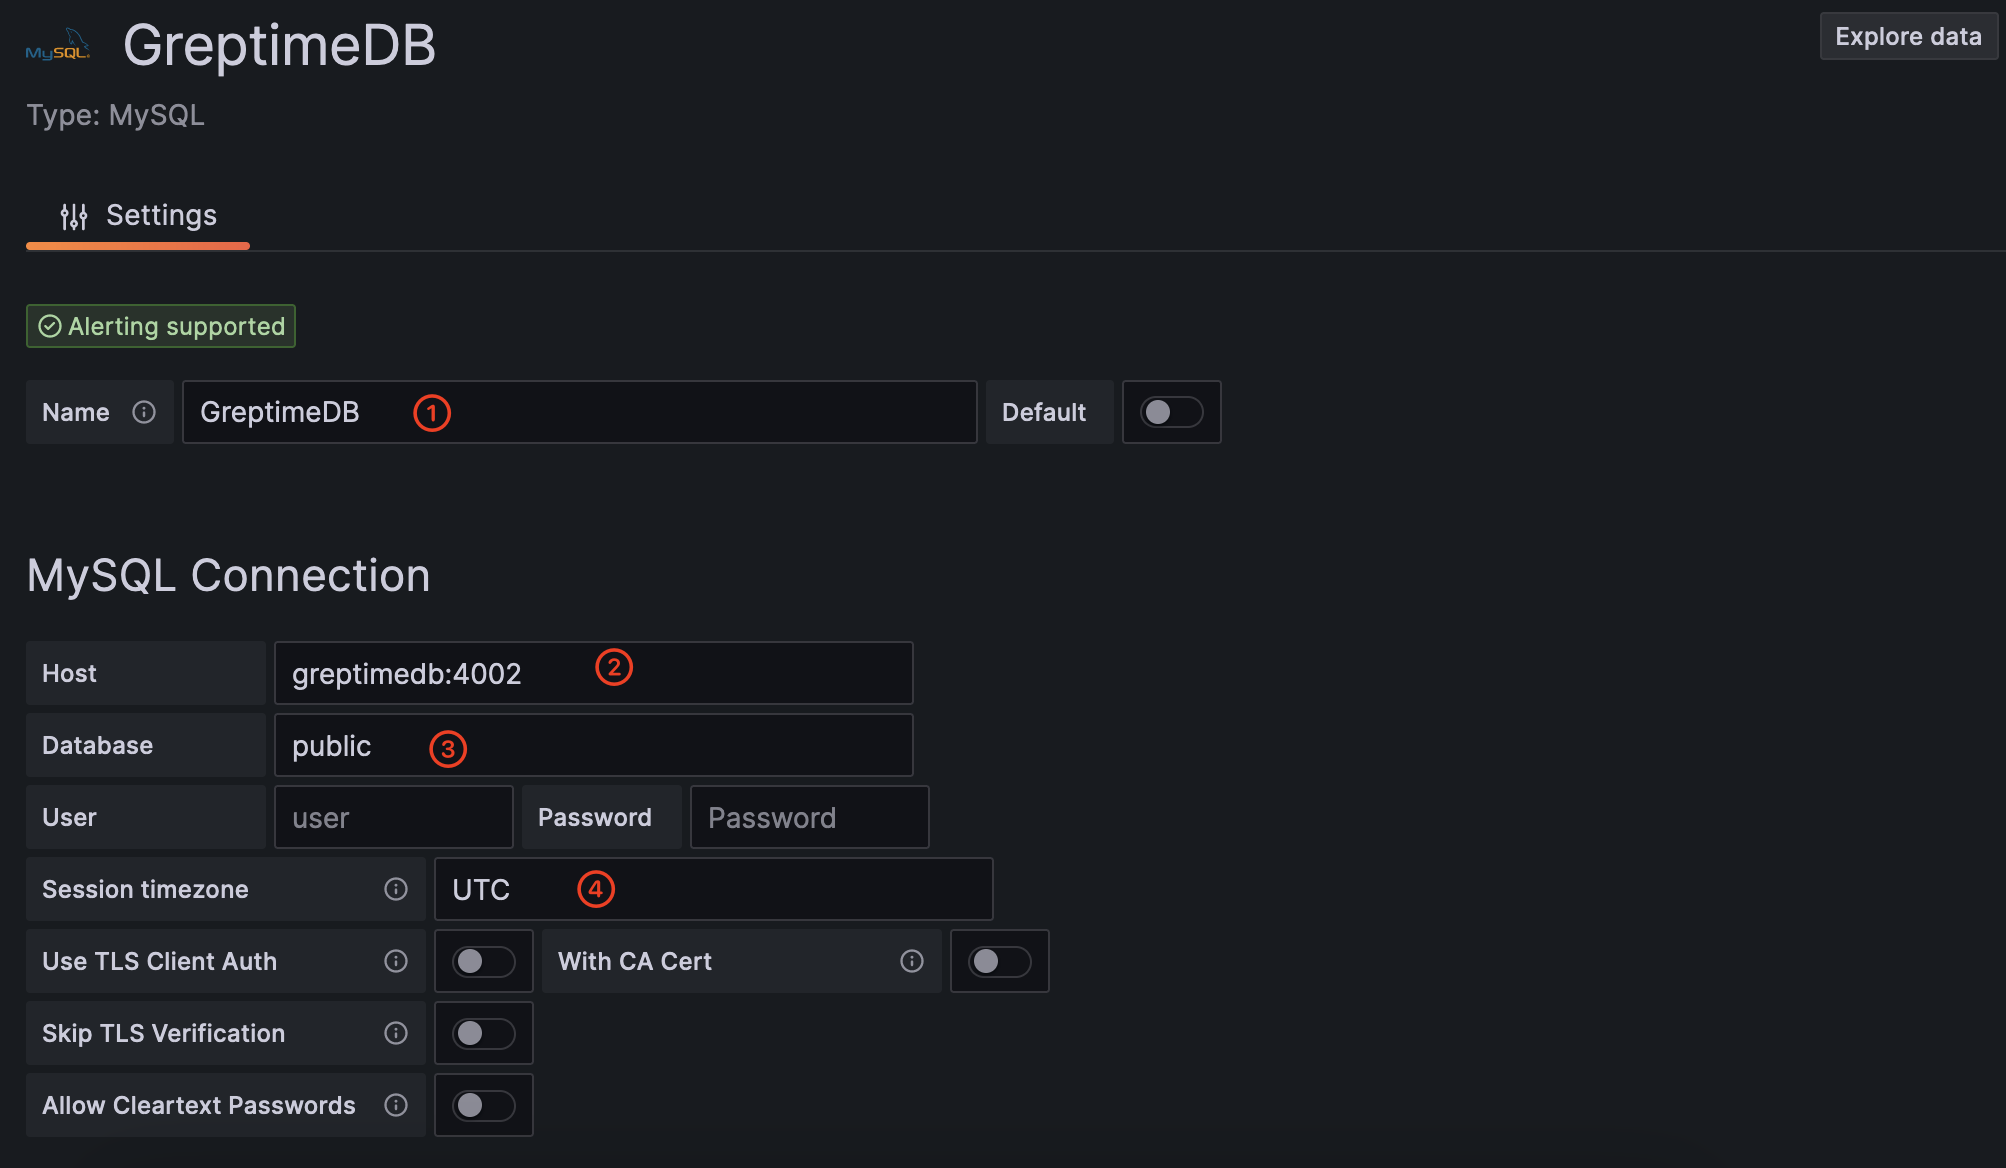
Click Save & Test button to test the connection.
For more information on using MySQL as a data source for GreptimeDB, please refer to Grafana-MySQL.
Create a Dashboard
To create a new dashboard in Grafana, click the Create your first dashboard button on the home page. Then, click Add visualization and select GreptimeDB as the data source.
In the Query section, ensure that you select GreptimeDB as the data source, choose Time series as the format, switch to the Code tab, and write the following SQL statement. Note that we are using ts as the time column.
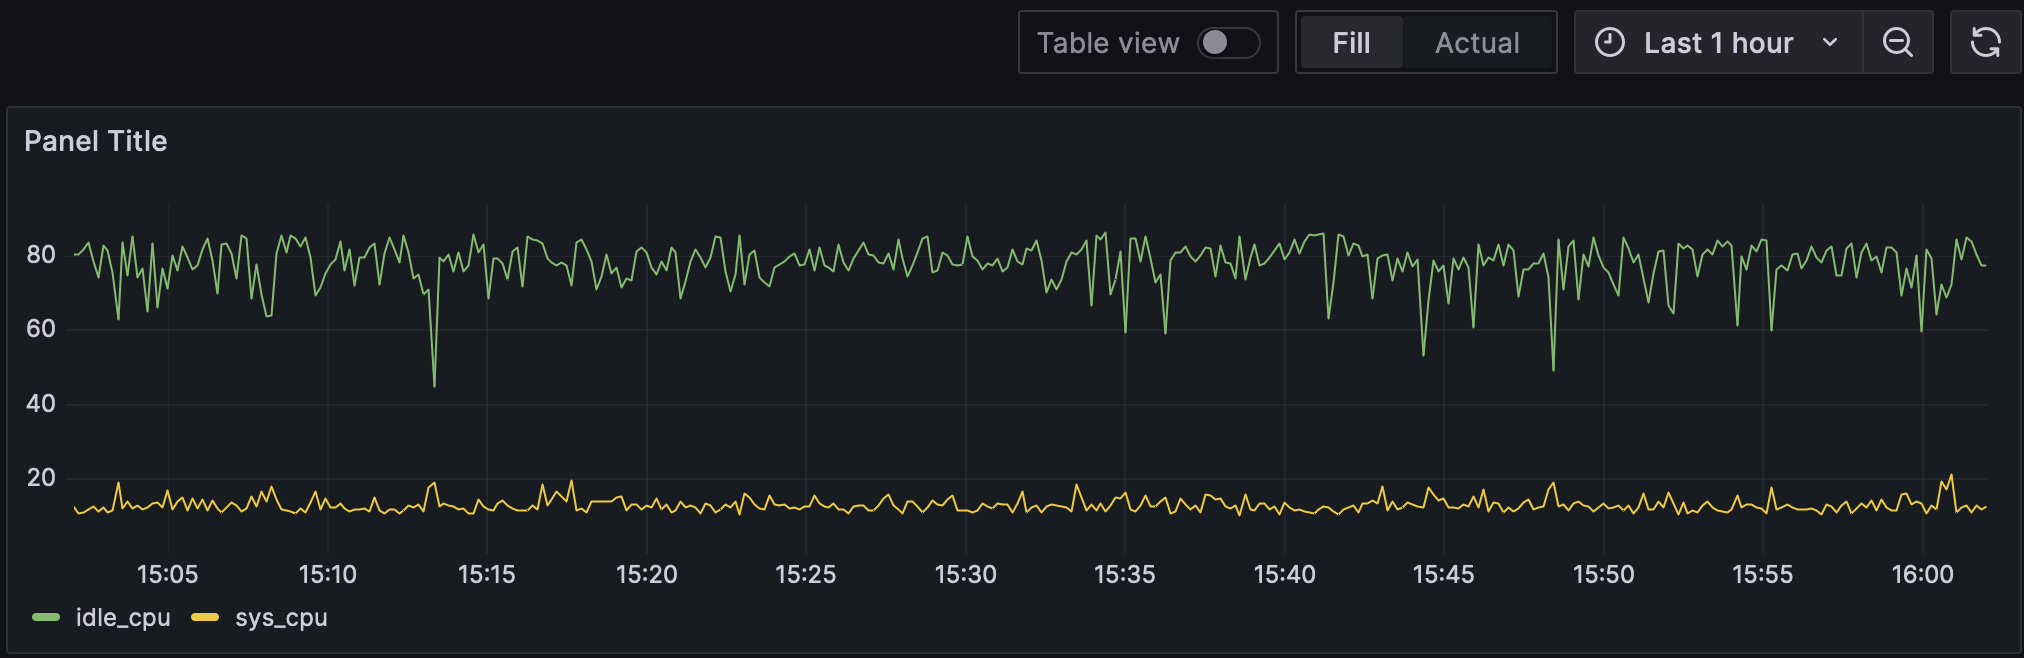
SELECT ts AS "time", idle_cpu, sys_cpu FROM public.monitorSELECT ts AS "time", idle_cpu, sys_cpu FROM public.monitor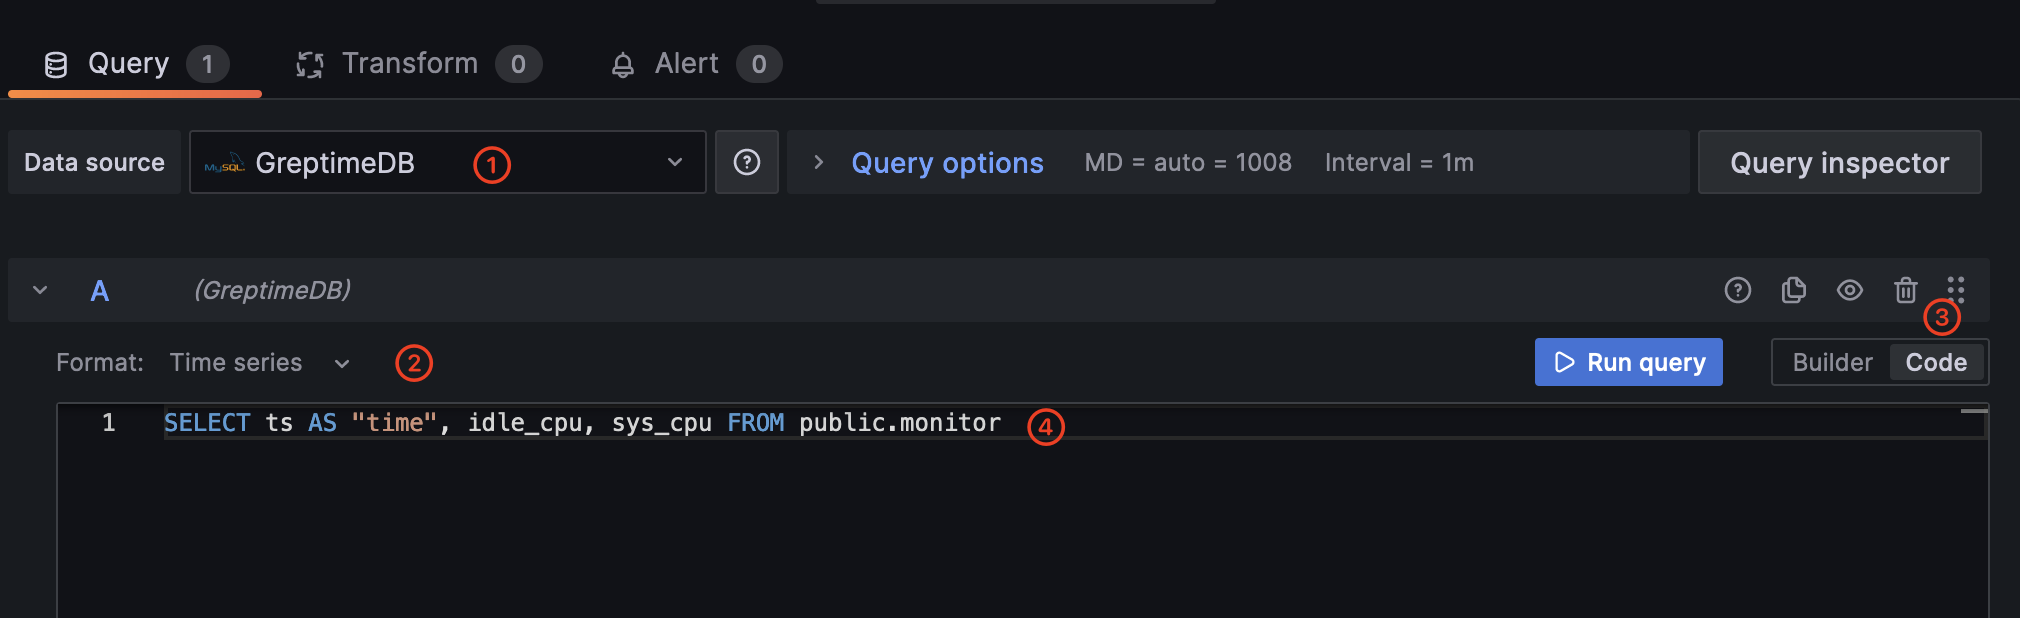
Click Run query to view the metric data.
Next Steps
Congratulations on quickly experiencing the basic features of GreptimeDB! Now, you can explore more of GreptimeDB's features by visiting the User Guide documentation.