Tracing
GreptimeDB supports distributed tracing. GreptimeDB exports all collected spans using the gRPC-based OTLP protocol. Users can use Jaeger, Tempo and other OTLP protocol backends that support gRPC to collect the span instrument by GreptimeDB.
In the logging section in the configuration, there are descriptions of configuration items related to tracing, standalone.example.toml provide a reference configuration in the logging section.
Tutorial: Use Jaeger to trace GreptimeDB
Jaeger is an open source, end-to-end distributed tracing system, originally developed and open sourced by Uber. Its goal is to help developers monitor and debug the request flow in complex microservice architectures.
Jaeger supports gRPC-based OTLP protocol, so GreptimeDB can export trace data to Jaeger. The following tutorial shows you how to deploy and use Jaeger to track GreptimeDB.
Step 1: Deploy Jaeger
Start a Jaeger instance using the all-in-one docker image officially provided by jaeger:
docker run --rm -d --name jaeger \
   -e COLLECTOR_ZIPKIN_HOST_PORT=:9411 \
   -p 6831:6831/udp \
   -p 6832:6832/udp \
   -p 5778:5778 \
   -p 16686:16686 \
   -p 4317:4317 \
   -p 4318:4318 \
   -p 14250:14250 \
   -p 14268:14268 \
   -p 14269:14269 \
   -p 9411:9411 \
   jaegertracing/all-in-one:latest
docker run --rm -d --name jaeger \
-e COLLECTOR_ZIPKIN_HOST_PORT=:9411 \
-p 6831:6831/udp \
-p 6832:6832/udp \
-p 5778:5778 \
-p 16686:16686 \
-p 4317:4317 \
-p 4318:4318 \
-p 14250:14250 \
-p 14268:14268 \
-p 14269:14269 \
-p 9411:9411 \
jaegertracing/all-in-one:latestStep 2: Deploy GreptimeDB
Write configuration files to allow GreptimeDB to perform tracing. Save the following configuration items as the file config.toml
[logging]
enable_otlp_tracing = true[logging]
enable_otlp_tracing = trueThen start GreptimeDB using standalone mode
greptime standalone start -c config.tomlgreptime standalone start -c config.tomlRefer to the chapter Mysql on how to connect to GreptimeDB. Run the following SQL statement in Mysql Client:
CREATE TABLE host (
ts timestamp(3) time index,
host STRING PRIMARY KEY,
val BIGINT,
);
INSERT INTO TABLE host VALUES
(0, 'host1', 0),
(20000, 'host2', 5);
SELECT * FROM host ORDER BY ts;
DROP TABLE host;CREATE TABLE host (
ts timestamp(3) time index,
host STRING PRIMARY KEY,
val BIGINT,
);
INSERT INTO TABLE host VALUES
(0, 'host1', 0),
(20000, 'host2', 5);
SELECT * FROM host ORDER BY ts;
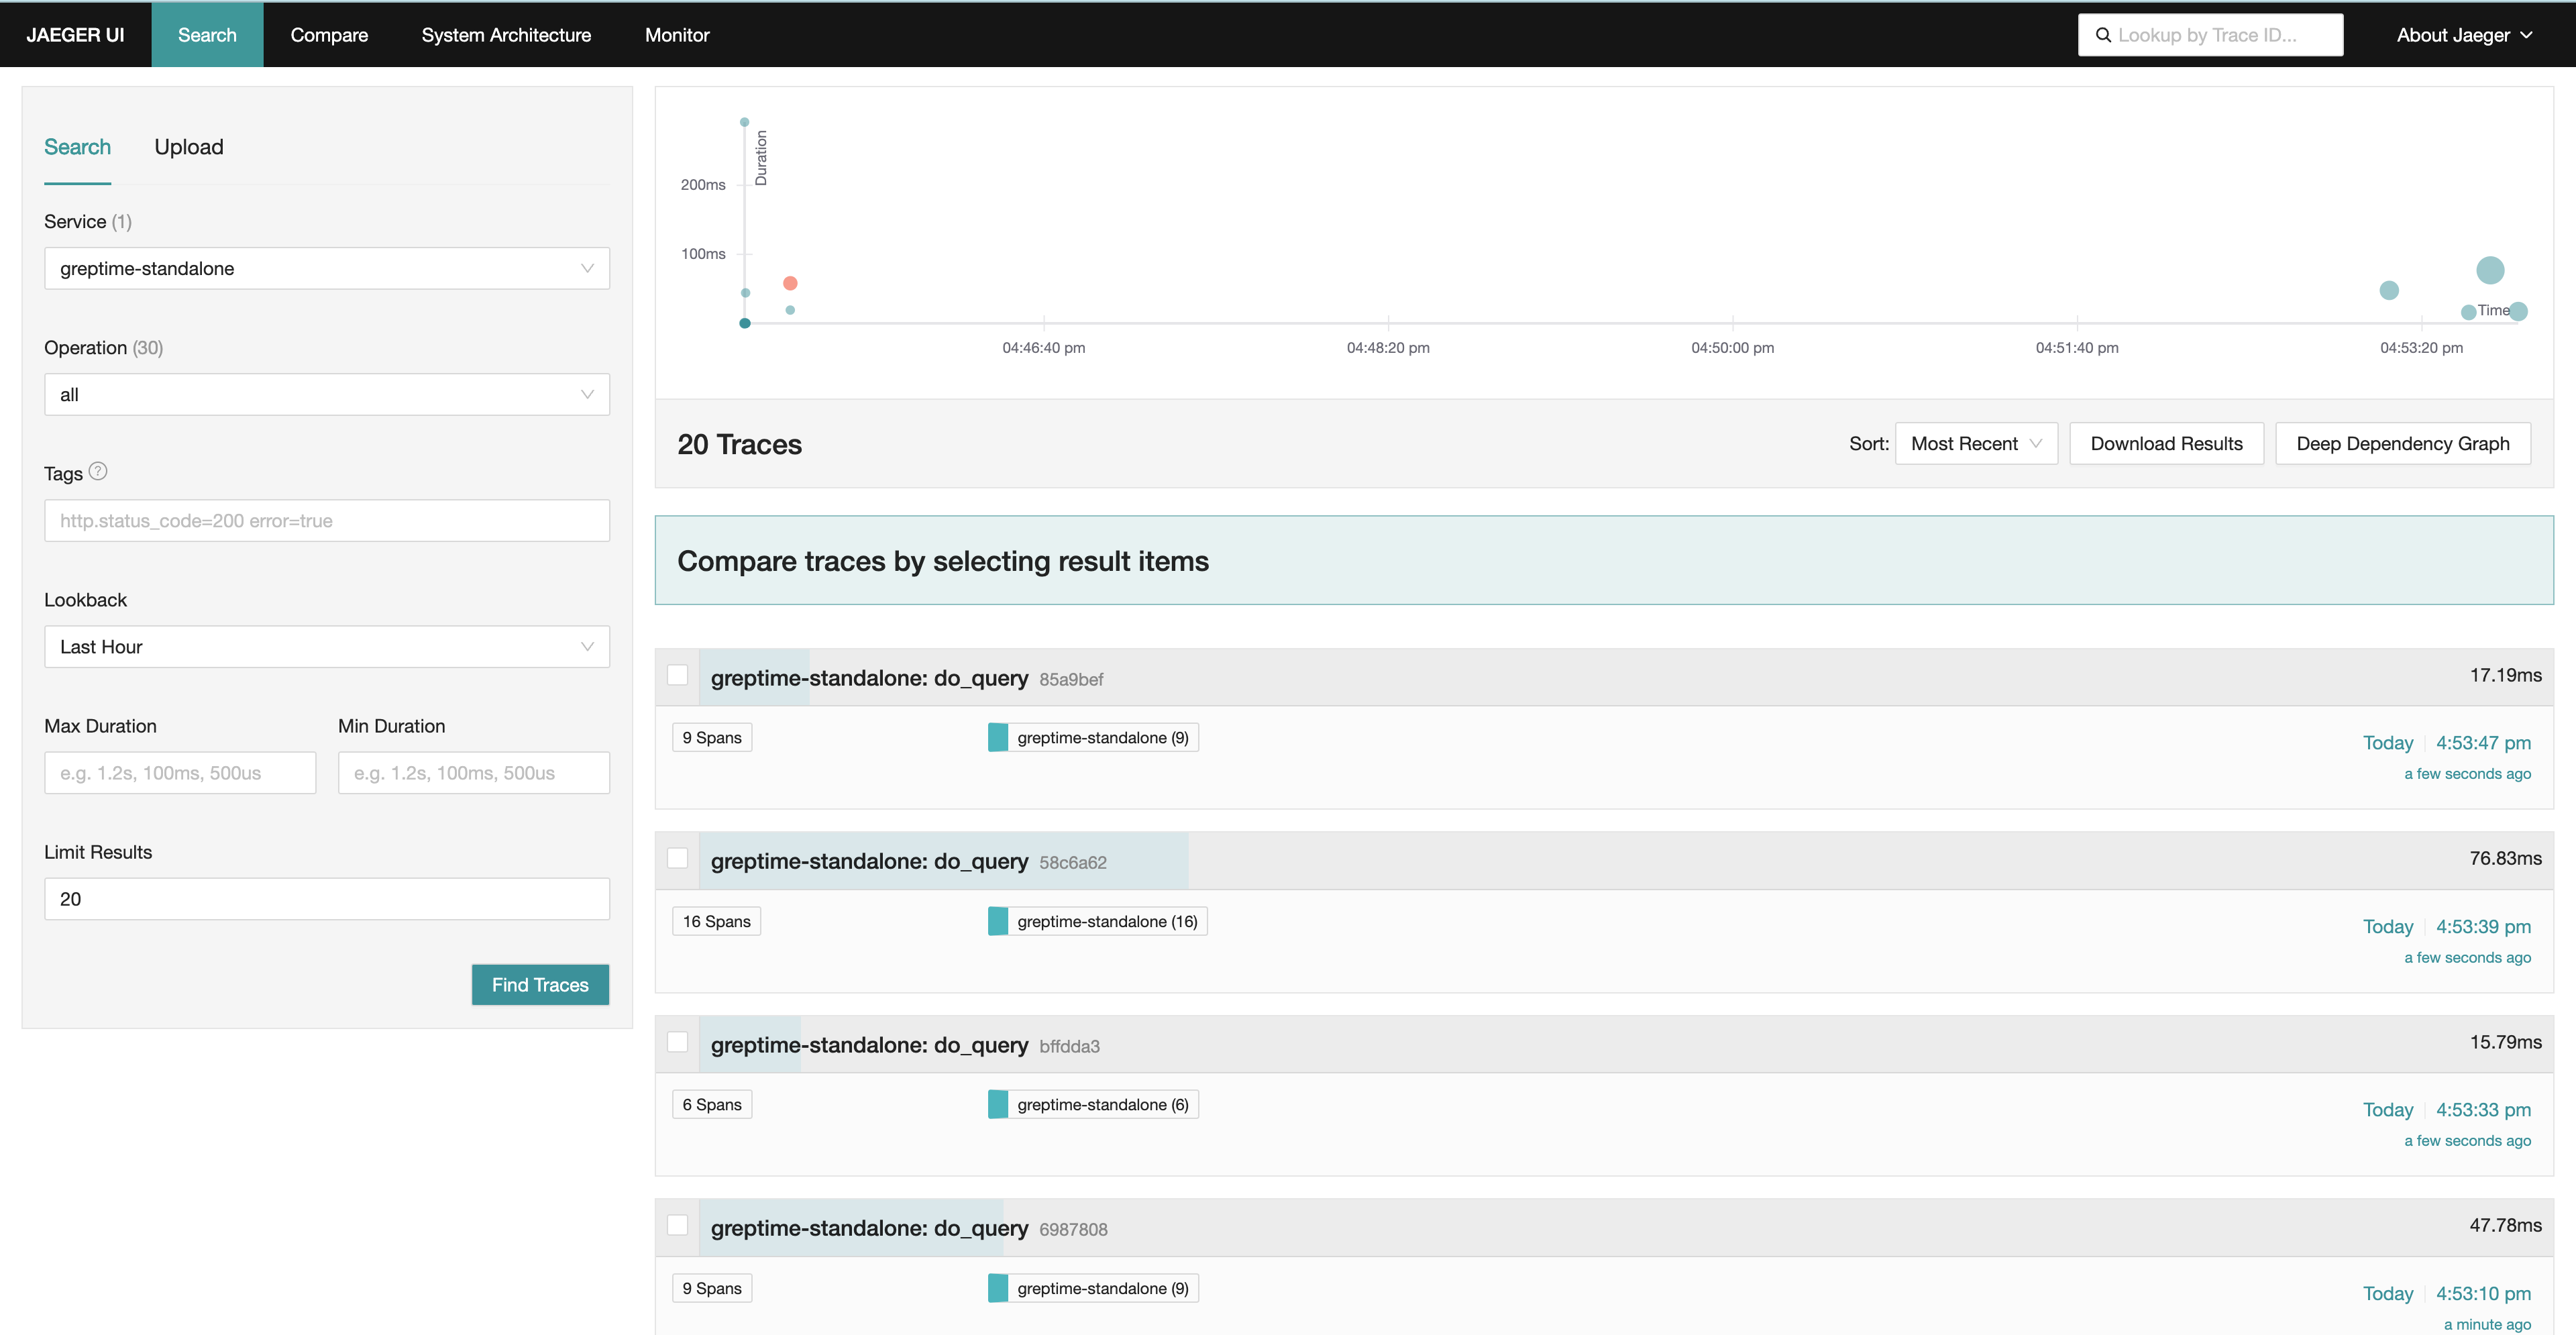
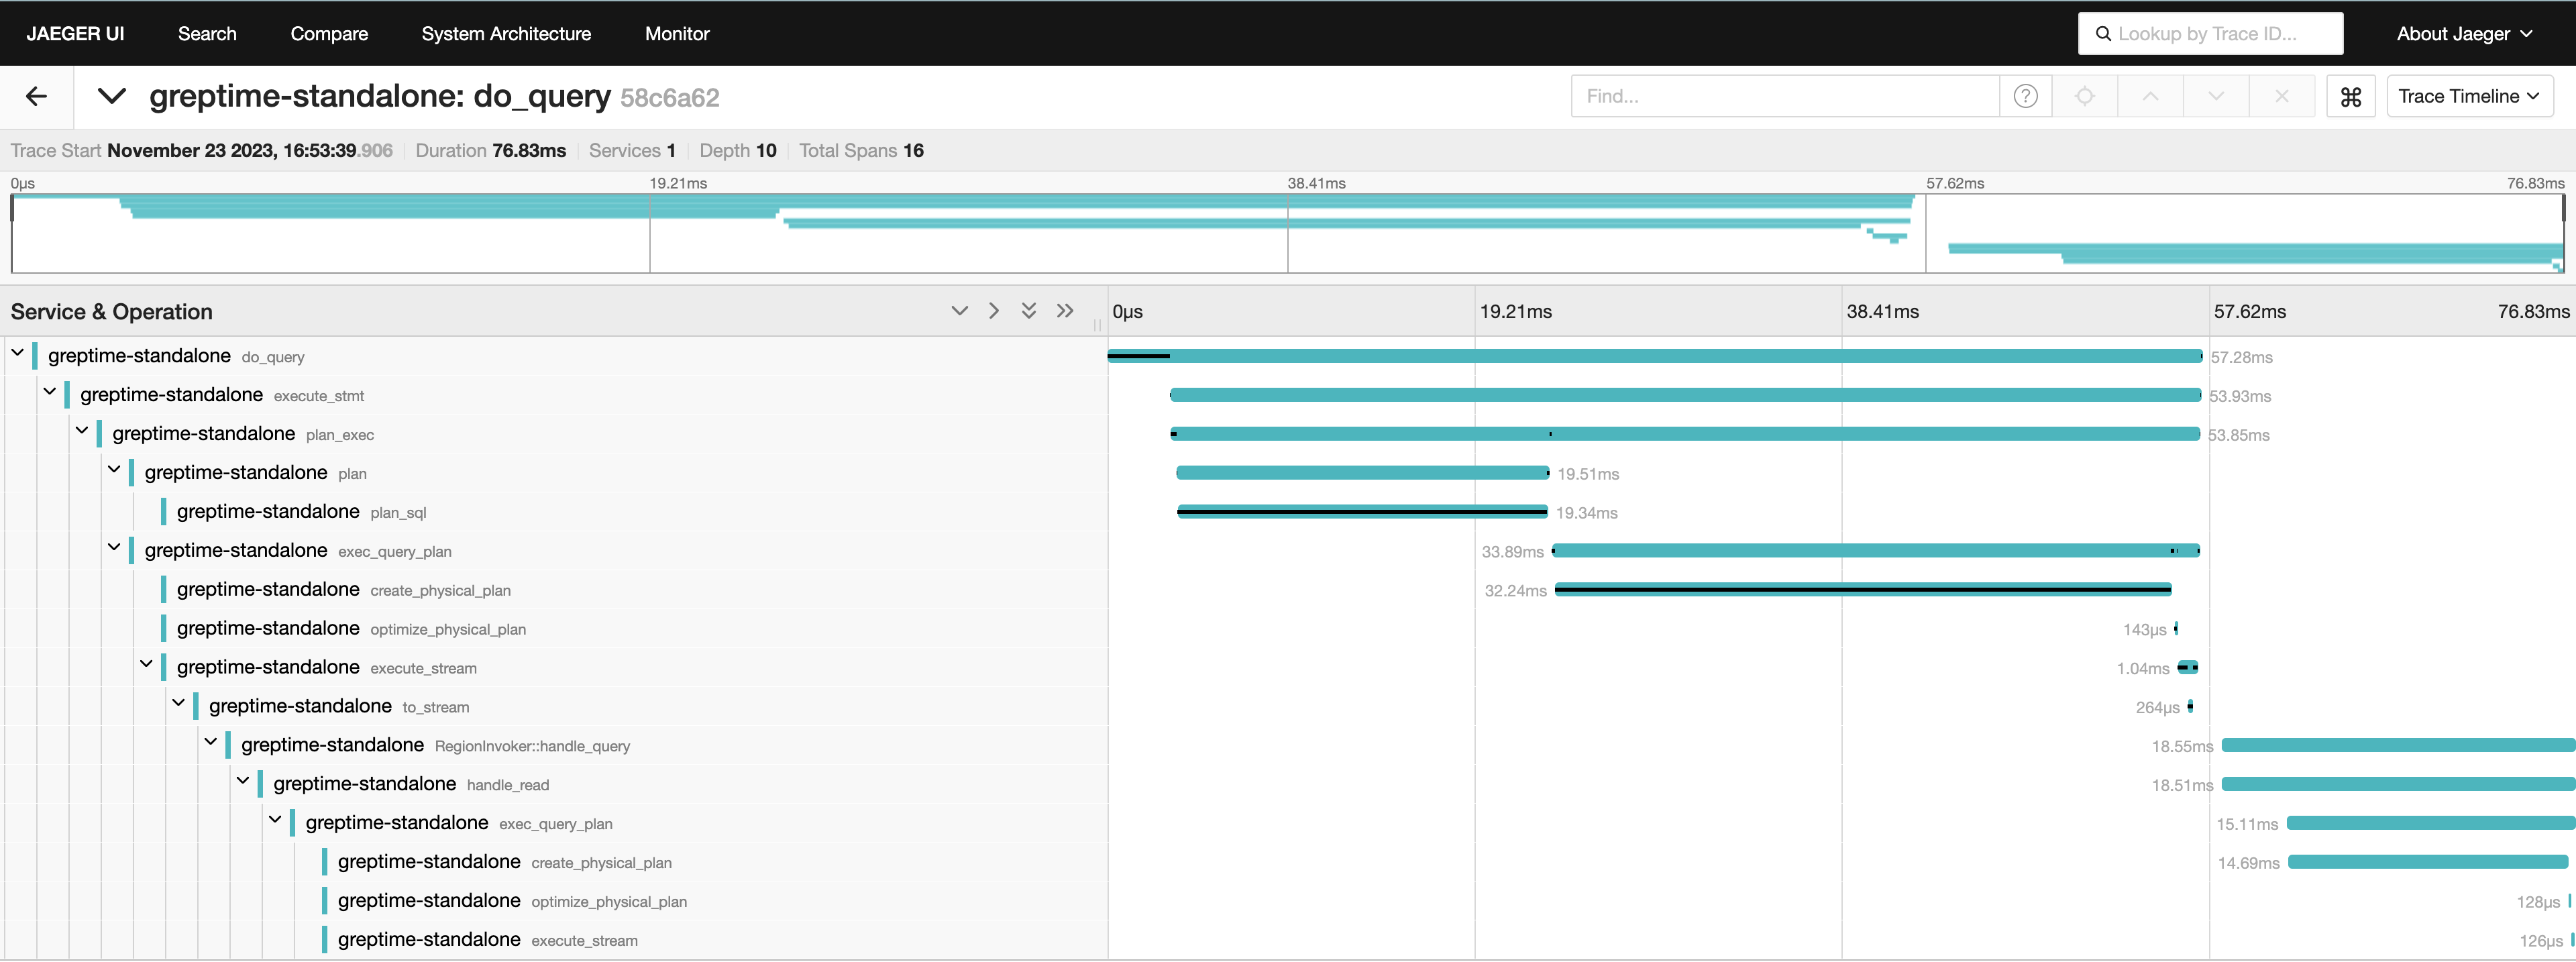
DROP TABLE host;Step 3: Obtain trace information in Jaeger
- Go to http://127.0.0.1:16686/ and select the Search tab.
- Select the
greptime-standaloneservice in the service drop-down list. - Click Find Traces to display trace information.
Guide: How to configure tracing sampling rate
GreptimeDB provides many protocols and interfaces for data insertion, query and other functions. You can collect the calling chains of each operation through tracing. However, for some high-frequency operations, collecting all tracing of the operation may be unnecessary and waste storage space. At this time, you can use tracing_sample_ratio to set the sampling rate of tracing for various operations, which can greatly reduce the number of exported tracing and facilitate system observation.
All tracing within GreptimeDB is classified according to the protocol it is connected to and the corresponding operations of that protocol:
| protocol | request_type |
|---|---|
| grpc | inserts / query.sql / query.logical_plan / query.prom_range / query.empty / ddl.create_database / ddl.create_table / ddl.alter / ddl.drop_table / ddl.truncate_table / ddl.empty / deletes / row_inserts / row_deletes |
| mysql | |
| postgres | |
| otlp | metrics / traces |
| opentsdb | |
| influxdb | write_v1 / write_v2 |
| prometheus | remote_read / remote_write / format_query / instant_query / range_query / labels_query / series_query / label_values_query |
| http | sql / promql |
You can configure different tracing sampling rates through tracing_sample_ratio.
[logging]
enable_otlp_tracing = true
[logging.tracing_sample_ratio]
default_ratio = 0.0
[[logging.tracing_sample_ratio.rules]]
protocol = "mysql"
ratio = 1.0
[[logging.tracing_sample_ratio.rules]]
protocol = "grpc"
request_types = ["inserts"]
ratio = 0.3[logging]
enable_otlp_tracing = true
[logging.tracing_sample_ratio]
default_ratio = 0.0
[[logging.tracing_sample_ratio.rules]]
protocol = "mysql"
ratio = 1.0
[[logging.tracing_sample_ratio.rules]]
protocol = "grpc"
request_types = ["inserts"]
ratio = 0.3The above configuration formulates two sampling rules and sets a default sampling rate. GreptimeDB will start matching from the first one according to the sampling rules, and use the first matching sampling rule as the sampling rate of the tracing. If no rule matches, default_ratio will be used as the default sampling rate. The range of sampling rate is [0.0, 1.0], 0.0 means not sampling, 1.0 means sampling all tracing.
For example, according to the rules provided above, all calls accessed using the mysql protocol will be sampled, data inserted using grpc will be sampled 30%, and all remaining tracing will not be sampled.