Grafana
GreptimeDB can be configured as a Grafana data source. You have the option to connect GreptimeDB with Grafana using one of three data sources: GreptimeDB, Prometheus, or MySQL.
GreptimeDB data source plugin
The GreptimeDB data source plugin is based on the Prometheus data source and adds GreptimeDB-specific features. The plugin adapts perfectly to the GreptimeDB data model, thus providing a better user experience. In addition, it also solves some compatibility issues compared to using the Prometheus data source directly.
Installation
The GreptimeDB Data source plugin can currently only be installed on a local Grafana instance. Make sure Grafana is installed and running before installing the plugin.
You can choose one of the following installation methods:
- Download the installation package and unzip it to the relevant directory: Grab the latest release from release page, Unzip the file to your grafana plugin directory.
- Use grafana cli to download and install:shell
grafana cli --pluginUrl https://github.com/GreptimeTeam/greptimedb-grafana-datasource/releases/latest/download/info8fcc-greptimedb-datasource.zip plugins install info8fccgrafana cli --pluginUrl https://github.com/GreptimeTeam/greptimedb-grafana-datasource/releases/latest/download/info8fcc-greptimedb-datasource.zip plugins install info8fcc
Note that you may need to restart your grafana server after installing the plugin.
Quick preview using Docker
Greptime provides a docker compose file that integrates GreptimeDB, Prometheus, Prometheus Node Exporter, Grafana, and this plugin together so you can quickly experience the GreptimeDB data source plugin.
git clone https://github.com/GreptimeTeam/greptimedb-grafana-datasource.git
cd docker
docker compose up
git clone https://github.com/GreptimeTeam/greptimedb-grafana-datasource.git
cd docker
docker compose upYou can also try out this plugin from a Grafana docker image:
docker run -d -p 3000:3000 --name=grafana --rm \
  -e "GF_INSTALL_PLUGINS=https://github.com/GreptimeTeam/greptimedb-grafana-datasource/releases/latest/download/info8fcc-greptimedb-datasource.zip;info8fcc" \
  grafana/grafana-oss
docker run -d -p 3000:3000 --name=grafana --rm \
-e "GF_INSTALL_PLUGINS=https://github.com/GreptimeTeam/greptimedb-grafana-datasource/releases/latest/download/info8fcc-greptimedb-datasource.zip;info8fcc" \
grafana/grafana-ossConnection settings
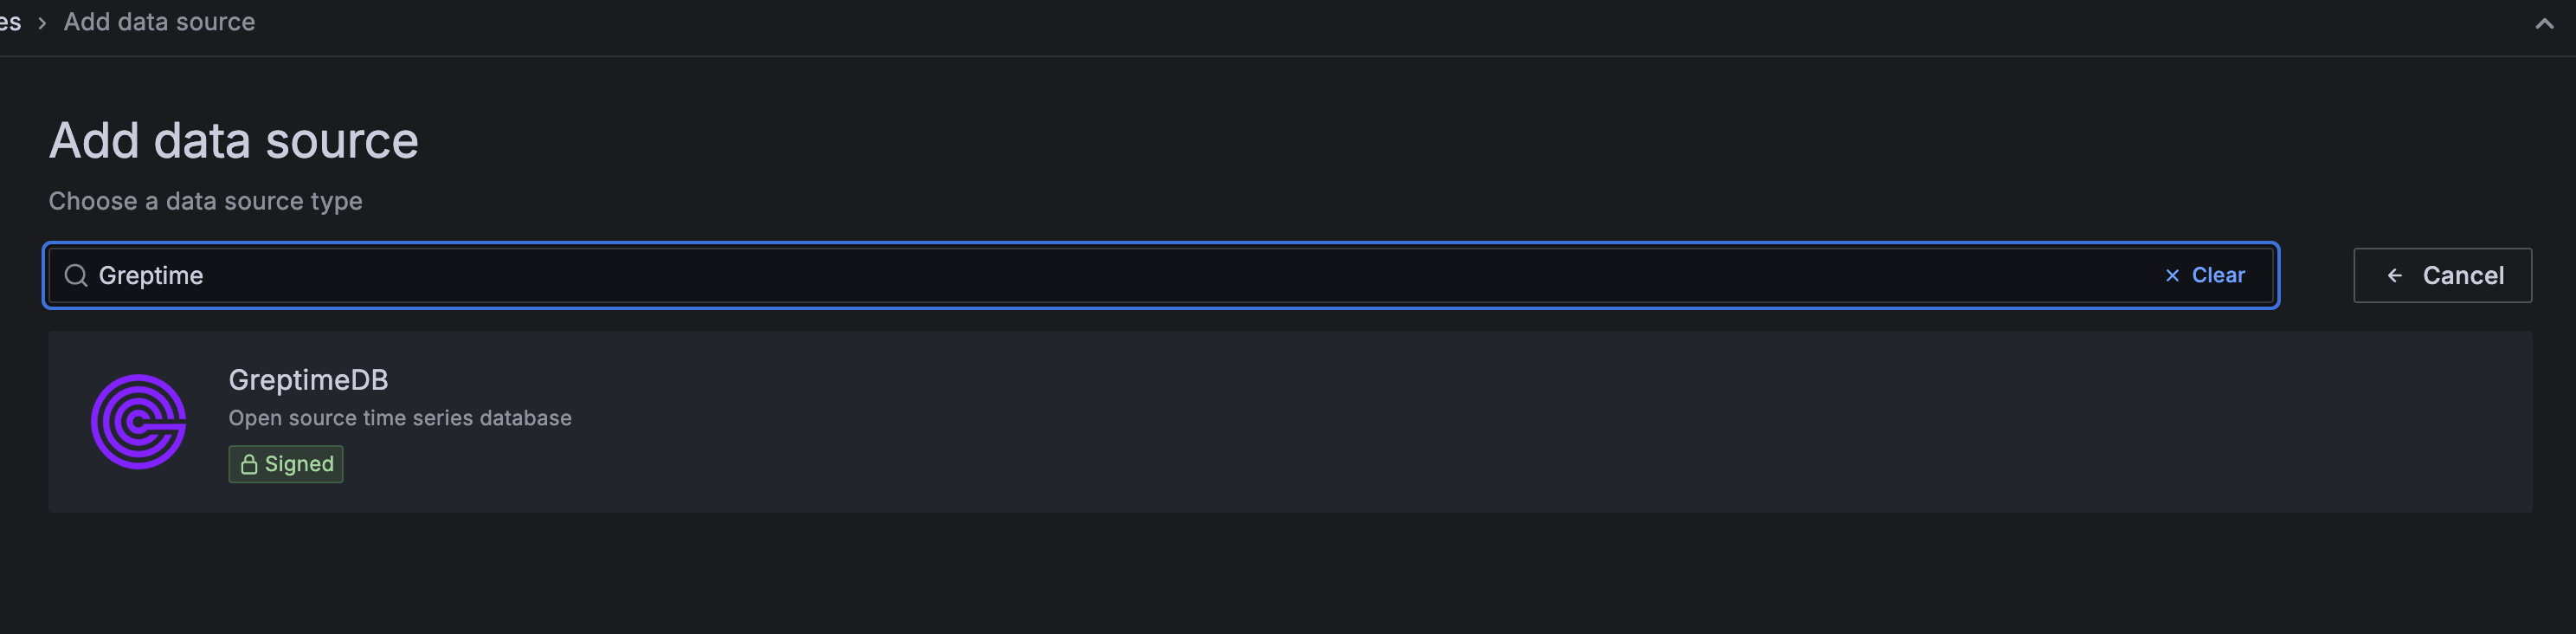
Click the Add data source button and select GreptimeDB as the type.
Fill in the following URL in the GreptimeDB server URL:
http://<host>:4000http://<host>:4000Then do the following configuration:
- Database Name:
<dbname>, leave it blank to use the default databasepublic - In the Auth section, click basic auth, and fill in the username and password for GreptimeDB in the Basic Auth Details section (not set by default, no need to fill in).
- User:
<username> - Password:
<password>
- User:
Then click the Save & Test button to test the connection.
Create a dashboard
Create a new dashboard in Grafana by clicking the Create your first dashboard button.
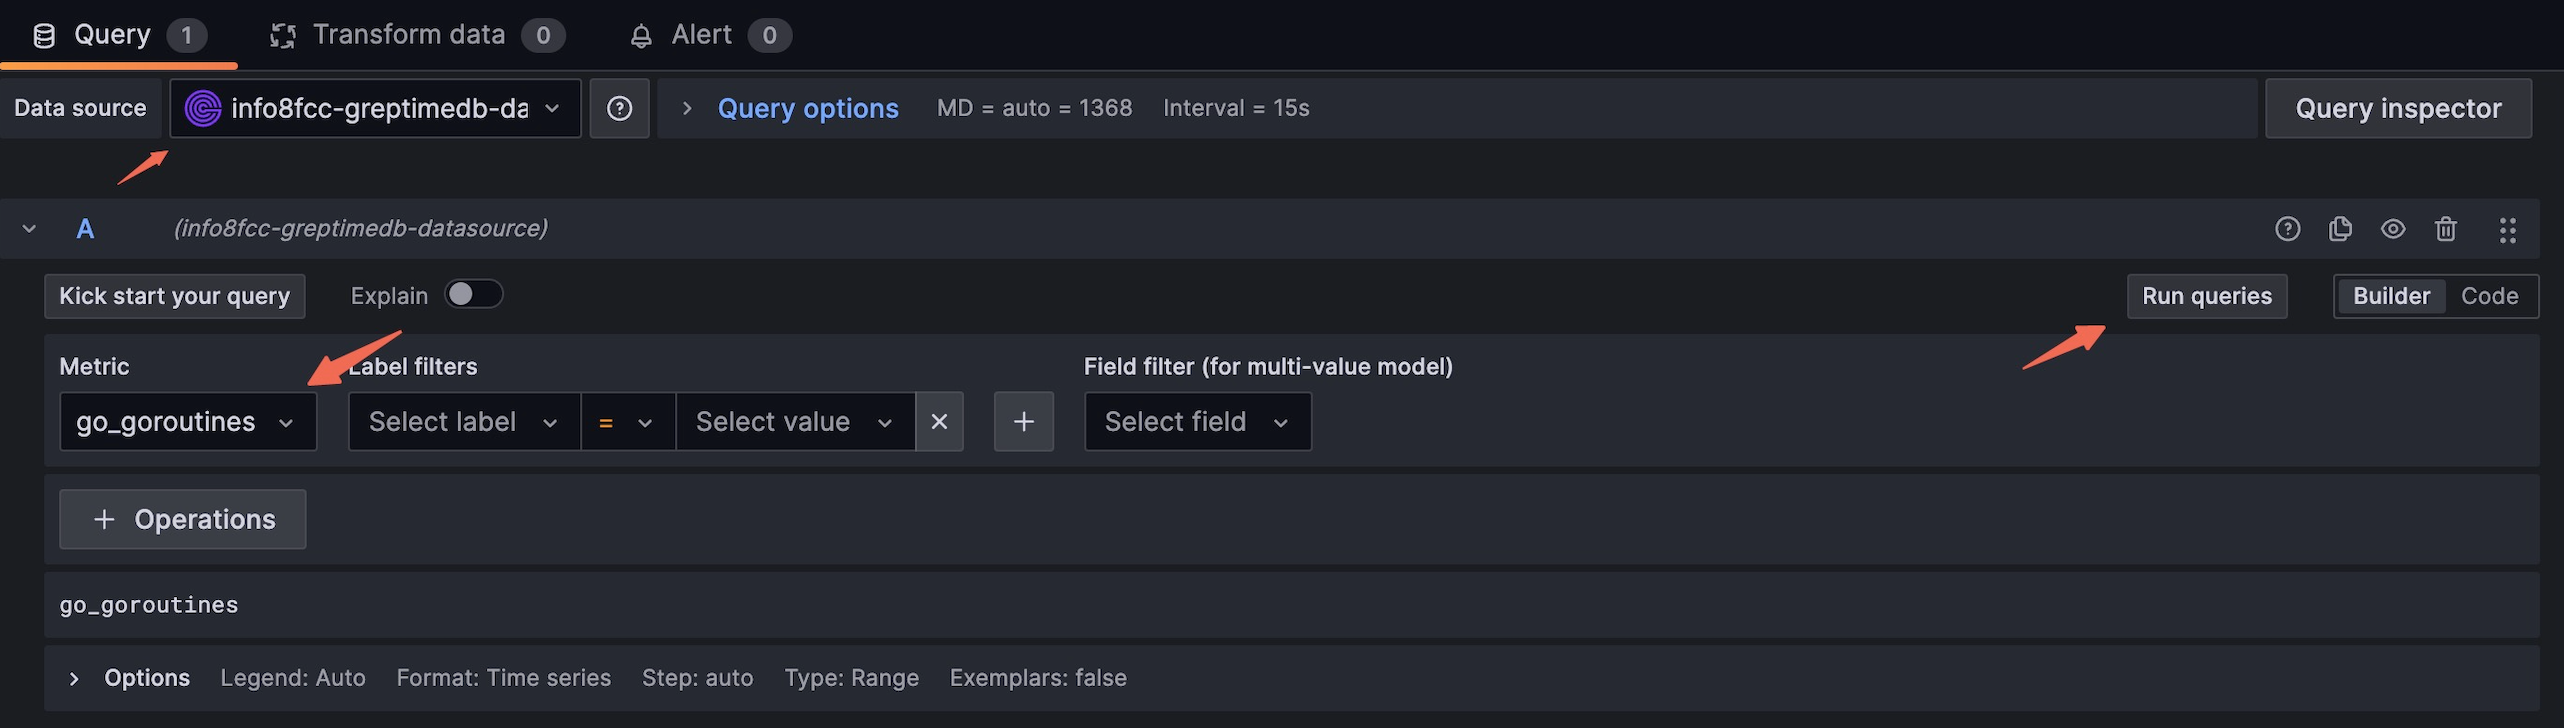
Then click Add visualization, select GreptimeDB as the data source.
Select a metric from the Metric dropdown list, then click Run queries to view the metric data.
When you see the data and confirm it is correct, click Save to save the panel.
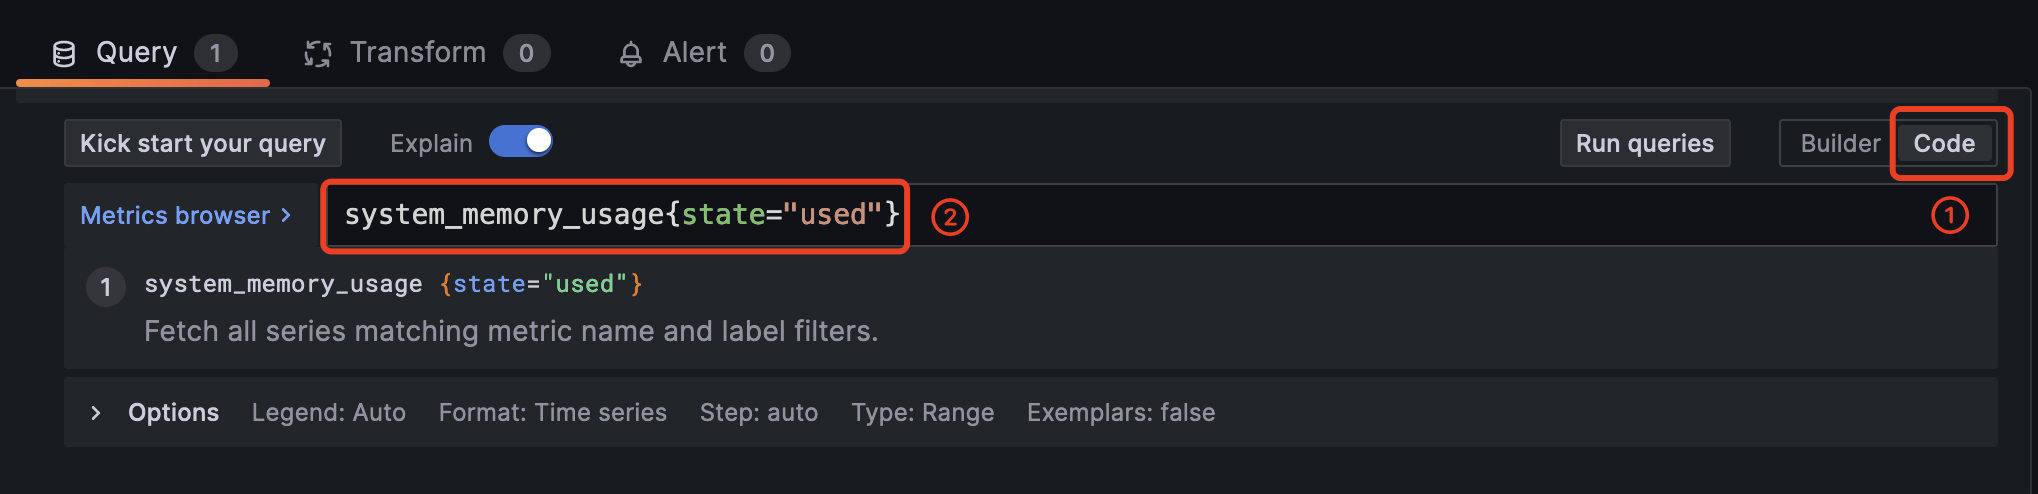
You can also create a panel using PromQL.
Click the code button on the right side of the Query tab to switch to the PromQL editor.
Then enter a PromQL statement, such as system_memory_usage{state="used"}, click Run query to view the metric data.
NOTE
GreptimeDB is compatible with most PromQL, but there are some limitations. Please refer to the PromQL limitations document for more information.
Prometheus data source
Click the Add data source button and select Prometheus as the type.
Fill in Prometheus server URL in HTTP:
http://<host>:4000/v1/prometheushttp://<host>:4000/v1/prometheusClick basic auth in the Auth section and fill in your GreptimeDB username and password in Basic Auth Details:
- User:
<username> - Password:
<password>
Click Custom HTTP Headers and add one header:
- Header:
x-greptime-db-name - Value:
<dbname>
Then click Save & Test button to test the connection.
MySQL data source
Click the Add data source button and select MySQL as the type. Fill in the following information in MySQL Connection:
- Host:
<host>:4002 - Database:
<dbname> - User:
<username> - Password:
<password> - Session timezone:
UTC
Then click Save & Test button to test the connection.
Note that you need to use raw SQL editor for panel creation. SQL Builder is not supported due to timestamp data type difference between GreptimeDB and vanilla MySQL.